Location:Home >> Detail
J Psychiatry Brain Sci. 2016;1(3):4; https://doi.org/10.20900/jpbs.20160013
 ,
Vindhya Rao4*
,
Vindhya Rao4*
1 Department of Psychiatry, Third People's Hospital of Tongling, Tongling, Anhui Province, 244000, China
2 Department of Biology Products, Elsevier Inc., Rockville, MD, 20852, USA
3 Department of Rheumatology, Johns Hopkins School of Medicine, Baltimore, MD 21205, USA
4 Unit on Statistical Genomics, National Institute of Mental Health, NIH, Bethesda, 20892, USA
*corresponding author: Hongbao Cao, Department of Biology Products, Elsevier Inc., Rockville, MD, 20852, USA; Tel: 1-240-461-9642
Additional correspondence: Vindhya Rao, Unit on Statistical Genomics, National Institute of Mental Health, NIH, Bethesda, 20892, USA, Tel: 301-496-9255.
Background: It is believed that the genetic causes of complex diseases, such as anxiety, are linked to large genetic networks. In recent years, there has been an increased number of studies reporting hundreds of genes associated with anxiety, posing the necessity for a systematic study of the genetic networks which underlie the disease.
Method: Disease (anxiety) - gene relation data was extracted from the Pathway Studio ResNet 11 Mammalian database yielding a total of 592 anxiety related genes. Pathway Enrichment Analysis, Sub-Network Enrichment Analysis, Network Connectivity Analysis and Network Metrics Analysis was conducted to study network attributes and select critical genes. Additionally, disease (anxiety) – drug, and drug - gene relation data was further studied in order to evaluate the known literature regarding the disorder of anxiety at the small molecule level.
Results: 526 out of the 592 anxiety related genes were enriched in a total of 100 pathways at a p-value < 1E-15, demonstrating strong and comprehensive pathway participation. Literature metrics analysis revealed 6 genes; DRD2, ADORA2A, IL1B, CRH, AVP, CRHR1, as top candidates for anxiety, in terms of replication frequency, network centrality, and pathway enrichment. Additionally, the majority of the anxiety candidate genes (538/592) demonstrated an interaction with 548/618 anxiety effective drugs, providing further support for the literature identified anxiety-gene relationship.
conclusion: Our results suggested that the genetic causes of anxiety were linked to a coherent genetic network composed of a large group of genes. This gene network, together with the literature and enrichment metrics provided in this study, lays the groundwork for further biological/genetic studies in the field.
Anxiety is a brain disease characterized by an unpleasant state of inner turmoil, often accompanied by nervous behavior, such as pacing back and forth, somatic complaints, and rumination[1]. This brain response is a basic emotion already present in infancy and childhood, with expressions falling on a continuum from mild to severe[2]. Although the cause for the most severe anxiety is still unknown, the risk is believed to be genetic in nature, with many genes expected to be involved[3]. As such, significant research into the causes are being explored.
Recent years have seen an increase in the number of articles reporting hundreds of genes related to anxiety, some of which have been considered as potential biomarkers for the disease, such as CRP, GLO1 and CLEC3B[4-6]. Additionally, several other genes including OXT have been studied in clinical trials[7,8]. Moreover, other articles have reported genetic and quantitative changes of genes in cases of anxiety[9-11]. Both increased and decreased gene expression levels/activities of marker genes has been observed[11,12]. Of note, many genes were reported to influence the pathogenic development of anxiety via an unknown mechanism[13,14]. Alternatively, some studies have reported functional mechanisms such as that of a mutation that can cause anxiety. For example, Rogers et al. suggested an association between anxiety and single-nucleotide polymorphisms in the CRHR1b splice variant, affecting neural circuits and diathesis[15].
Nevertheless, no systematic analysis has evaluated the quality and strength of these reported genes as a functional network/group, in part, to study the underlying biological processes of anxiety. In this present study, instead of focusing on any specific gene, we attempted to discover the comprehensive genetic network underlying the pathogenic development of the disease. We hypothesized that the majority, if not all, of these previously reported genes played roles in the development of anxiety, and that the major pathways/gene sets enriched by these genes were the candidate anxiety pathways through which these genes influenced the pathogenesis of the disease.
The study was laid out as follows: 1) Disease-gene relation data analysis in order to identify anxiety candidate genes, 2) Enrichment analysis of the identified genes in order to study their pathogenic significance to anxiety and to identify candidate anxiety pathways, 3) Network connectivity analysis (NCA) to test the functional association between these reported genes and the relative strength of these associations, 4) Metrics analysis to generate node attributes and identify top nodes; 5) Anxiety-drug-gene relation data was used to evaluate connections between anxiety, anxiety related genes and anxiety related small molecules.
2.1 Acquisition of anxiety-gene relation dataThe anxiety-gene relation data was acquired from the Pathway Studio ResNet 11 Mammalian Database, updated July 2016. The genes identified were used as the candidate network nodes for the constructed anxiety-gene network reported here. The ResNet® Mammalian Database includes curated signaling, cellular process, metabolic pathways, ontologies and annotations, as well as molecular interactions and functional relationships extracted from the 35M+ references covering the entire PubMed abstract database and from 4M+ full text journals from Elsevier and other major publishers. The resulting databases are used for data mining and pathway building.
Updated weekly, the ResNet® Mammalian database contains information for over 6.6M functional relationships for human, rat, and mouse, all linked to their original literature sources. Entities in the database include: 1) 142,270 proteins, 2) 106,732 small molecules, 3) 8863 cell processes, 4) 15,911 diseases, 5) 5,038 functional classes, 6) 4,387 Clinical Parameters, 7) 559 Protein complexes, and 8) 767 cell types (including an extensive catalogue of immune response related cell types identified by cell surface markers) .
2.2 Identification of anxiety candidate pathwaysTo better understand the underlying functional profile and the pathogenic significance of the reported genes, a pathway enrichment analysis (PEA) was performed allowing the identification of candidate anxiety pathways. Additionally, a Sub-Network Enrichment Analysis (SNEA) was conducted[16]. SNEA, an extension of PEA, constructs gene sets “on the fly” using the global network of protein-disease regulation as represented in the Pathway Studio database. In this study, we performed SNEA using all anxiety candidate genes against a protein- disease related subnetwork, for the purpose of identifying diseases that share a genetic basis with anxiety. For detailed information regarding SNEA please refer to[16].
2.3 building the edges of the networkBoth literature and pathway based network connectivity analysis (NCA) was conducted to study associations between anxiety related genes and to build weighted edges between the nodes within the network. The literature based NCA (LNCA) was performed using Pathway Studio in order to identify specific connectivity between given genes/proteins pairs. The weight of an edge is equivalent to the number of scientific references underlying a reported gene-gene interaction. The pathway based NCA (PNCA) was conducted using the candidate pathways identified. The weight of an edge is the number of pathways that include both nodes.
2.4 Literature metrics analysisFor the weighted network referenced above, we proposed 4 attributes for each node, including 2 literature based metric scores (RScore and AScore), and 2 enrichment based metric scores (PScore and SScore). The proposal of these metrics was based on the logic that if a gene satisfies the following conditions, it is linked to AD with high probability: 1) has been observed frequently in independent studies to be associated with AD (high RScore); 2) plays roles within multiple pathways related to AD (high PScore); 3) demonstrates strong functional linkage to many of other genes that were also associated with AD (high SScore). Additionally, we also propose the AScore to represent the history of each AD-gene relation and to highlight novel genes (e.g., AScore = 1 for the genes identified in this year, 2016). The detailed definition for the proposed metrics are described as follows.
2.4.1 two literature metricsWe define the reference number underlying a gene-disease relationship as the gene’s reference score (Rscore), as shown in Eq. (1).
RScore = The number of references underlying a relationship (1)
We define the earliest publication age of a gene-disease relationship as the gene's age score (Ascore) as shown in Eq. (2).
AScore = max1≤i≤n ArticlePubAgei (2)
where n is the total number of references supporting a gene-disease relation, and
ArticlePubAge = Current date - Publication date + 1 (3)
2.4.2 Two enrichment metricsGiven a disease which is associated with a set of pathways ℛ, we then define a pathway score (PScore) as the number of the ℛ pathways which include the gene.
PScorek = The number of pathways from Rincluding the kth gene (4)
We define a network significance score (SScore) of a node as the normalized centrality of the node within a network, as shown in Eq. (5).
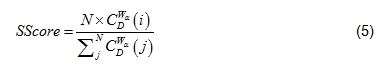
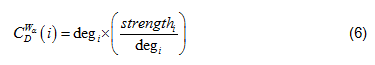
Where is the total number of nodes within the network; is the generalized centrality of the node[17], which is defined as Eq. (6).
And is the Freeman's formalized node degree centrality[18], as defined as Eq. (7),
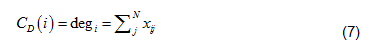
Where N is the total number of nodes, i is the focal node, and j represents all other nodes; x is the adjacency matrix, in which the cell xij is 1 if node i and j are connected, or 0 if not. Note: For network edges built by PNCA, CD∈[0,N].
Andstrengthin Eq. (6) is the node strength [19], defined as the sum of weights of node's direct ties, i.e.:

where w is the weighted adjacency matrix. The cell wij is greater than 0 if the node i is connected to node j, and its value represents the weight of the tie. Note, for network edges built by PNCA, 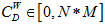 , where M is the total number of candidate pathways.
In Eq. (5), when 0 < a < 1, both high degree and strong ties are favorably measured, whereas, for values of a greater than 1, lower degrees and stronger ties are favorably measured[17]. In this study, we set a = 0.5, such that the node degree and node strength were equally evaluated.
2.5 Validation at the small molecule levelWe hypothesized that the regulation of significant anxiety candidate genes should be involved in the disease pathology and therefore may also be involved directly with the clinical treatment of the disease. If true, these candidate genes should be present in upstream-regulation relations with drugs that are effective in treating anxiety. To test for the potential relationship between anxiety candidate genes and anxiety effective drugs, anxiety-drug and drug-gene relation data were separately extracted from Pathway Studio and then comparatively analyzed. All drugs within the relation data sets have been shown effective in treating anxiety by preclinical studies or clinical trials, and all genes have been identified as anxiety candidate genes through anxiety-gene relation data (related supporting data are provided in Supplementary Information).
Analysis of the Pathway Studio anxiety-gene relation data identified 592 anxiety candidate genes, supported by 2,723 references. The full results are located in Supplementary Table S1a, including the list of all 592 genes, associated metric scores and related pathways. Supporting reference information is provided in Supplementary Table S1b (please note that genes with either ‘m_*’ and ‘r_*’ prefixes represent genes identified in mouse and rat, respectively).
3.1.1 Anxiety-gene relation data summaryOf the 592 genes associated with anxiety, 430 (72.6 %) genes represented a relationship of regulation to the disease, 294 (49.7 %) genes represented a relationship of genetic change with the disease, 88 (14.9 %) genes represented a relationship of quantitative change with the disease, 8 (1.5 %) genes represented a relationship of state change with the disease, 3 (0.3 %) genes represented a relationship of biomarker with the disease, and 1 (0.2 %) genes was associated with a clinical trial (Figure 1a). Please note, 178 (30.1 %) of these genes have been reported to have multiple relationships with the disease. Specifically, 414 (69.9 %) genes were extracted with only one type of relationship to the disease, 132 (22.3 %) with 2, 3.7 (6.4 %) with 3, and 8 (1.35 %) with 4. For detailed definition and description of these relation types, please refer to the ‘Relation Types and Definitions’ section at Pathway Studio ResNet Database Description and Workflow Examples.
Publication date distributions of the underlying 2,723 articles supporting the gene-anxiety relationships are presented in Figure 1b, with novel genes reported in each year presented in Figure 1c. Interestingly, these articles have an average publication age of only 6.0 years, indicating that most of the articles were published in the last decade. Additionally, our analysis showed that the publication date distributions of the articles underlying each of the 592 genes were similar to that presented in Fig 1b (data not shown).
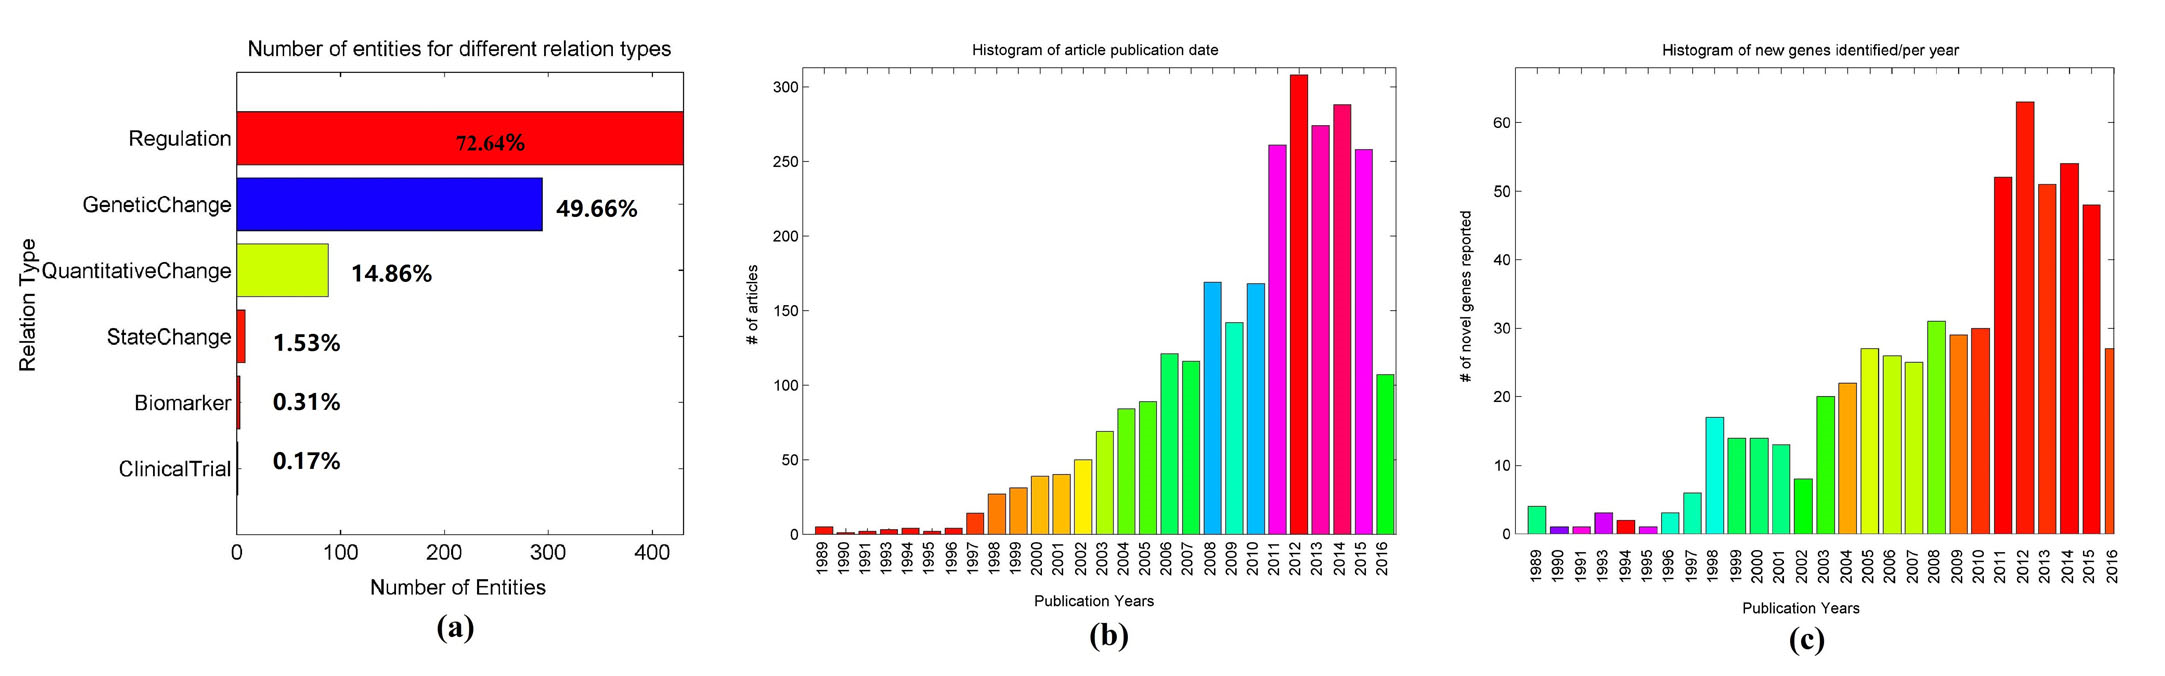 Fig 1 Histogram of the publications reporting gene-disease relationships between anxiety and 592 genes. (a) Number of genes for different relation types; (b) number of article publications by year; (c) number of novel genes
identified in each year.
Fig 1 Histogram of the publications reporting gene-disease relationships between anxiety and 592 genes. (a) Number of genes for different relation types; (b) number of article publications by year; (c) number of novel genes
identified in each year.
Among the 592 anxiety related genes, 27 were reported in 2016 with an AScore = 1, and are listed in Table 1. For comparison purposes, Table 1 also lists the top 27 genes with the highest Rscore (in descending order). Full results are provided in Supplementary Table S1.
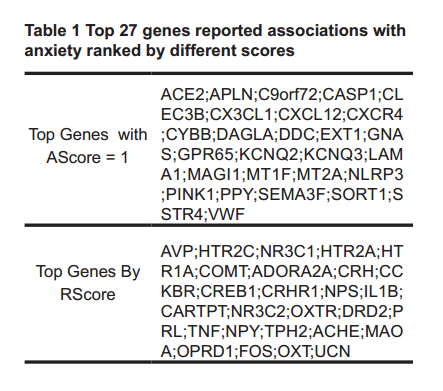 table 1 top 27 genes reported associations with anxiety ranked by different scores
In this section, we present the PEA and SNEA results for all 592 genes.
3.2.1 enrichment analysis on all 592 genesIn Table 2, we present the top 20 pathways/groups enriched with 451/592 genes (p-value < 1.8E-32). The full list of 100 pathways/gene sets enriched with 526/592 genes (p-value < 1E-15) are listed in Supplementary Table S2.
Among the 100 pathways/gene sets enriched, we identified 13 pathways/gene sets that were related to the neuronal system (with 381 unique genes), 5 related to brain function/development (94 unique genes), 5 related to behavior (95 unique genes) and 1 related to transcription factors (93 unique genes). In addition, we identified one ontology term related to aging (54 unique genes).
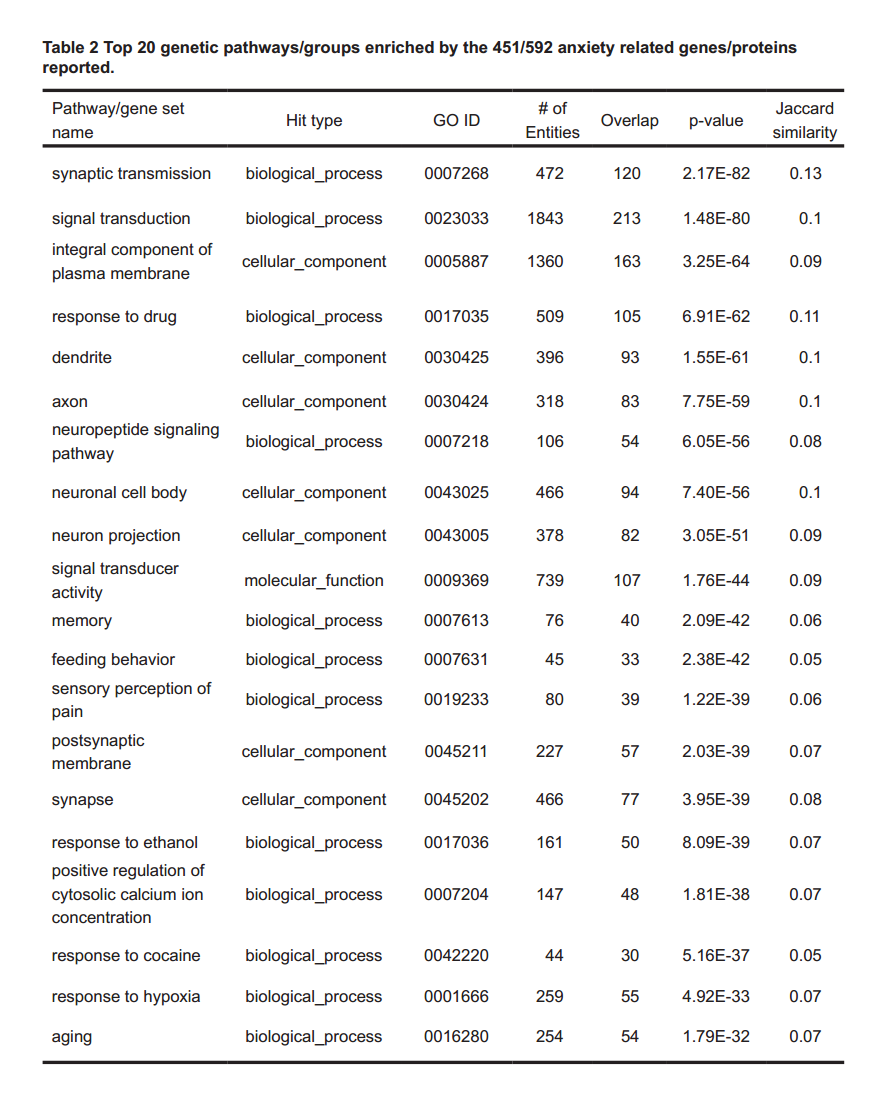 table 2 top 20 genetic pathways/groups enriched by the 451/592 anxiety related genes/proteins reported.
Besides PEA, we also performed a SNEA using Pathway Studio for the purpose of relating the pathogenic significance of the reported anxiety genes to other mental disease disorders potentially related to anxiety. The top 10 diseases shown to be enriched by this method are shown in Table 3. Anxiety related genes were highly significantly shared with schizophrenia, major depressive disorder and obesity suggesting major overlaps at the molecular level for these psychiatric disorders. We saw that many of these reported anxiety related genes were also identified in other mental health related diseases, with a large percentage of overlap (Jaccard similarity > 0.13). The disease of anxiety itself was enriched by this method which is not surprising since these genes were all chosen for association of some kind with the disease and, as such, this finding acts as a positive control for the analysis. A list of the top 100 results is provided in Supplementary Table S3.
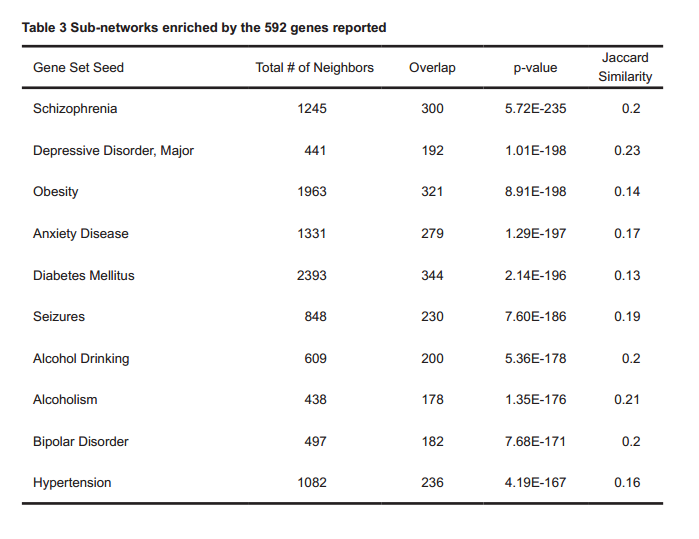 table 3 sub-networks enriched by the 592 genes reported
Two types of NCA, literature based NCA (LNCA) and pathway based NCA (PNCA), were performed to generate two separate networks with the same nodes (genes/proteins) but different types of weighted edges. The connectivity identified by LNCA is literature-based on but may not be directly related to anxiety and, therefore, did not contribute to the connectivity of the anxiety genetic network. We used LNCA to test gene-gene interaction and PNCA to derive pathway and network significance scores (PScore and Sscore, respectively).
3.3.1 LNcA to test sub-group connectivityWe performed a LNCA on the top 27 genes with the highest RScores and AScores (from Table 1) to generate gene-gene interaction networks. Results showed that, for the RScore group, there were 366 connections overall among all 27 genes, as shown in Figure 2a, supported by more than 2000 articles. In contrast, genes within the AScore group demonstrated only 37 relations among 17 genes, as shown in Figure 2b, with 10 genes showing no direct relation with other genes in the group (Fig 2b; highlighted in green). This observation suggests that recently identified, novel anxiety related genes are not as functionally related to each other as are those from the high scoring, well studied RScore group.
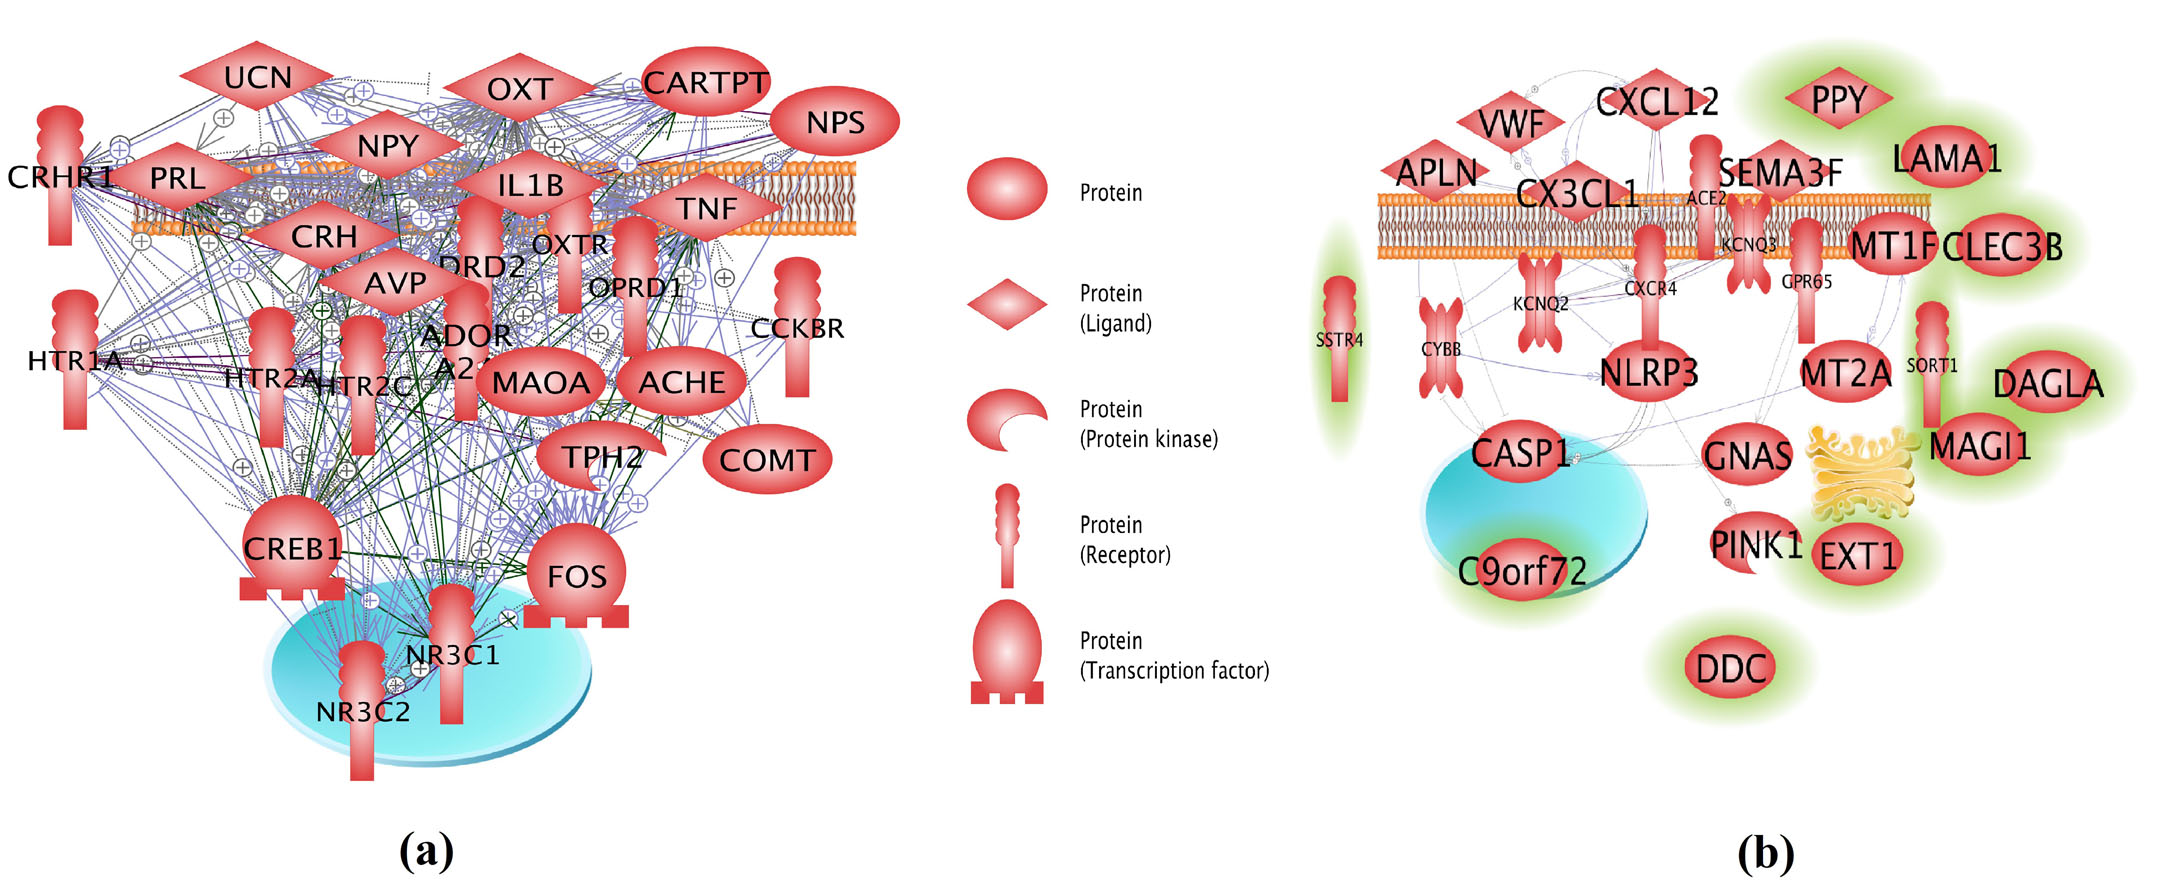 Fig 2 Connectivity networks built by 27 genes from top RScore (a) and SScore (b) groups. The networks were generated using Pathway Studio. Unconnected genes are highlighted in green.
PNCA showed that, among the 592 genes (network nodes), there were 71,258 edges connecting 526 genes with 66 genes connected to no other nodes (see Supplementary Information, Table S4). The average node strength (sum of the adjacent edge weights) of the network was 257.8, and the node strength for the 66 unconnected genes was signed with 0. Figure 3a and Supplementary Information, Table S5 present the network adjacency matrix of the genetic network built using the 526/592 genes.
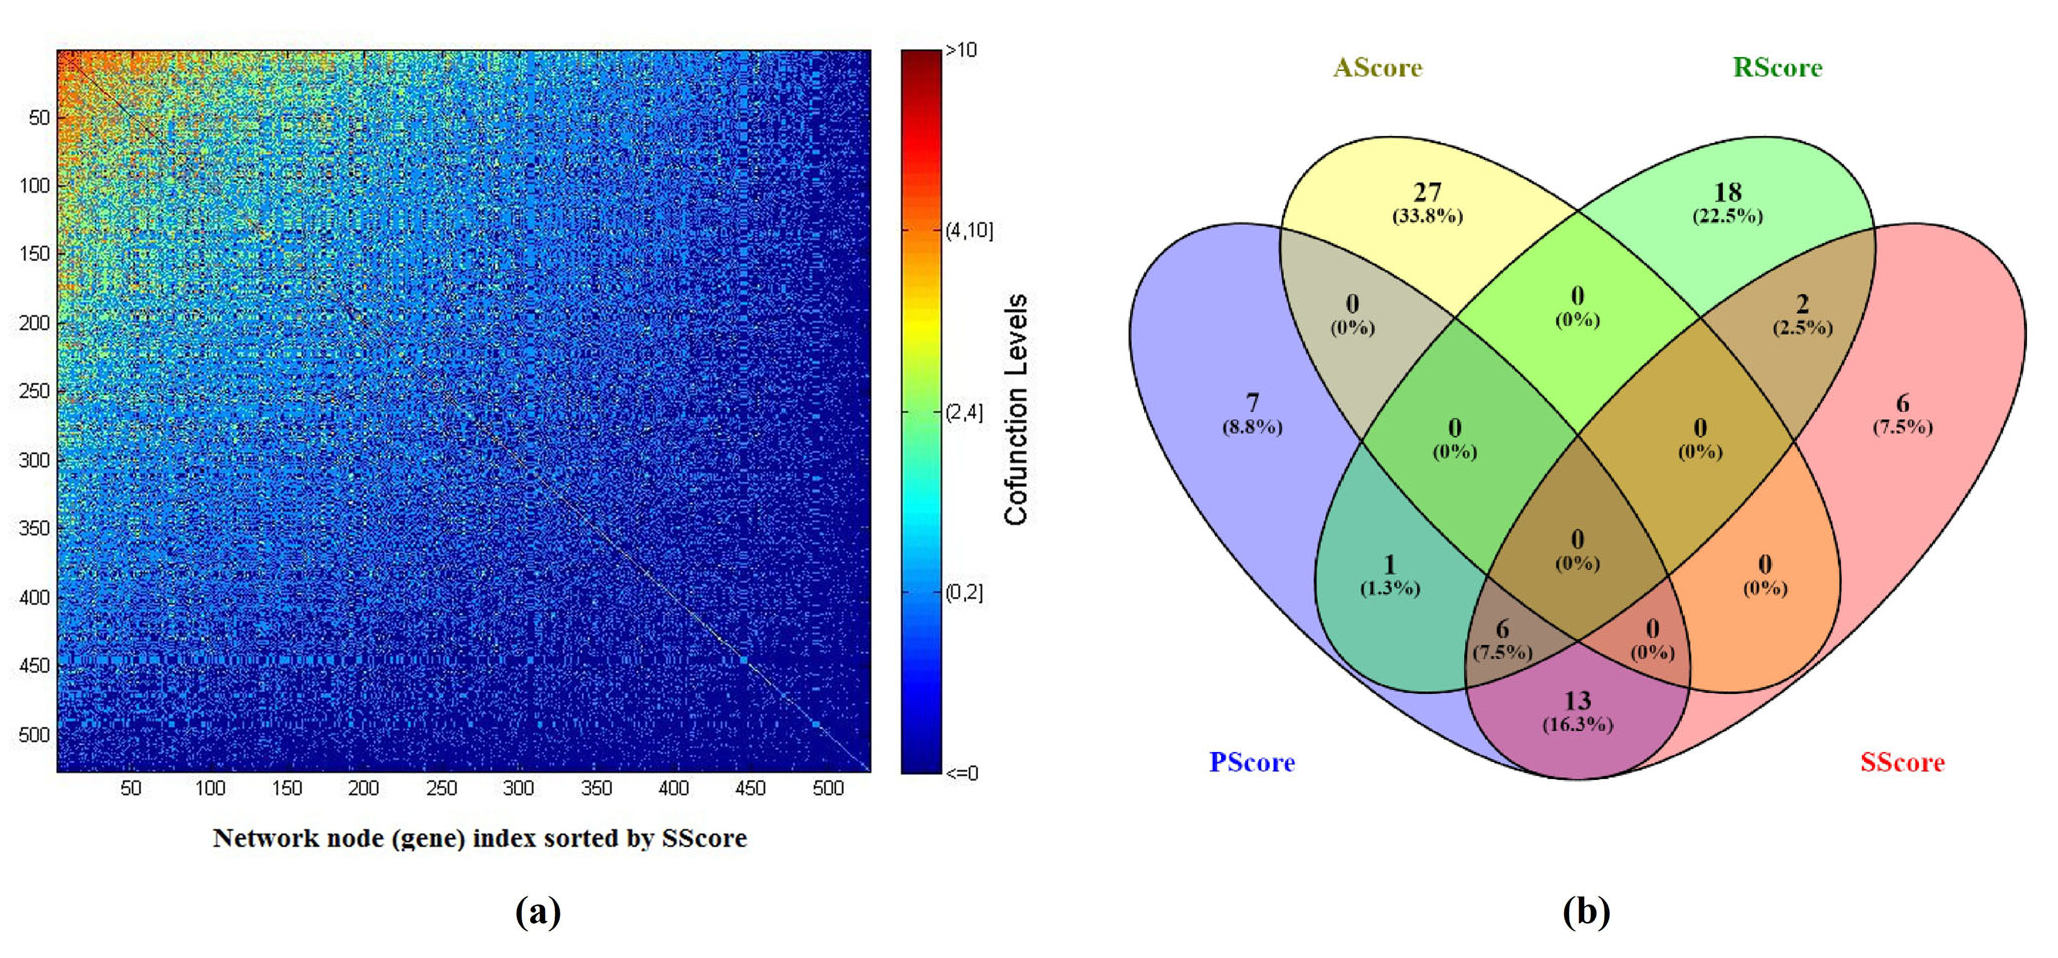 Fig 3 Comparison of different metrics ranking the 592 genes. (a) Adjacency matrix of the genetic network built with the 526/592 genes as nodes and PNCA generated weights; (b) A Venn diagram of top 27 genes selected by different metrics.
Using the edges built by PNCA, we generated two biological metrics, pathway score (PScore) and network significance score (SScore), for each gene (See Supplementary Table S1). The value of a PScore represented how many anxiety candidate pathways involved the node, and a SScore showed how significant the node was to the network.
To study the relationship between the two enrichment metrics and the two literature metrics, we performed a cross-analysis of the top 27 genes selected using different scores, and present a Venn diagram in Fig. 3b. There is a strong overlap between PScore group and SScore (19/27). These 19 genes were found to be in the most significantly enriched pathways. Among the 27 genes, 6 genes (DRD2, ADORA2A, IL1B, CRH, AVP and CRHR1) overlapped among the highest SScore, PScore and RScore groups, with average RScore = 44.8 ± 25.3 references, average PScore = 24.3 ± 3.7 pathways, and average SScore = 2.0 ± 0.2.
On the other hand, there were 13 genes observed in both PScore group and SScore group, but not in RScore group, including; DRD1, GRIN1, GPER1, GRM7, ADRB2, GRIA1, NTRK2, CHRNA7, ADORA1, OPRM1, GRIN2B, TACR1, DRD3. These genes played roles within many significant pathways of anxiety disease (24.9 ± 5.0 pathways) and demonstrated strong network centrality (SScore = 2.0 ± 0.2). Although these genes were not novel (average AScore: 10.4 ± 5.6 years) and were not as highly replicated as others (average RScore: 6.9 ± 5.1 references), our results suggested that they were worthy of further study in the context of anxiety
3.4 Validation from anxiety drug studiesAnalysis of anxiety-drug relation data showed that there were 618 drugs that have been proven effective in treating anxiety, supported by 3,832 preclinical or clinical studies (see Supplementary Table S6). Furthermore, 65 out of the 618 drugs have been through clinical trials (Figure 5a).
The gene-drug relation study showed that there were 20,683 relations connecting 538/592 anxiety candidate genes and 548/618 anxiety drugs, supported by 105,257 references (see Supplementary Table S7a and Table S7b). Additionally, we observed that 437/592 anxiety candidate genes presented 3,604 relations with all 65 clinical tested anxiety drugs, supported by 18,869 references (see Supplementary Table S8). We present the top 1,000 Gene-Drug relations in Figure 4b.
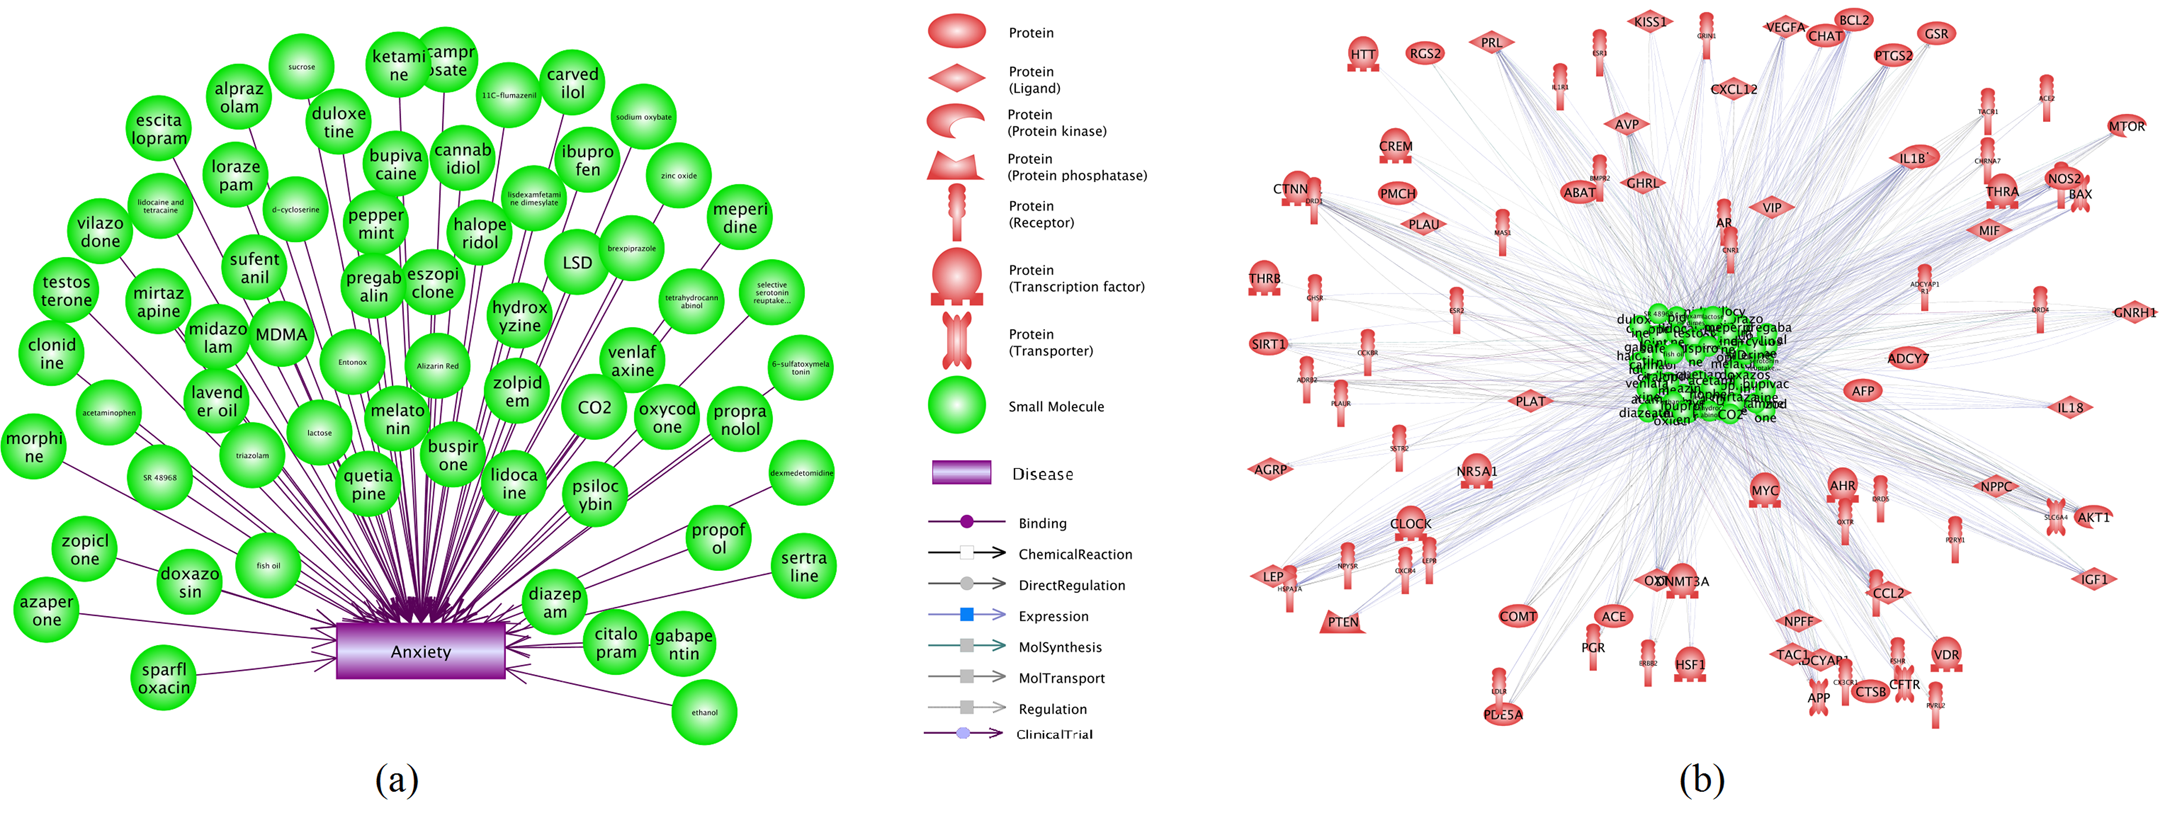 Fig 4 Drugs studied in the context of anxiety and their relation with the candidate anxiety genes. (a) The 65 drugs/small molecules studied in clinical trials for the treatment of anxiety; (b) The top 1,000 relations between the 65 drugs and 437 anxiety candidate genes.
Results from this study revealed a complex genetic network associated with anxiety. Network node (gene) and edge (gene-gene interaction) attributes were studied and presented. Additionally, we discovered further validation for these literature associated anxiety genes relative to the disease of anxiety at the small molecule level using anxiety related drug studies.
Pathway enrichment analysis results showed that most genes identified by this study were included in the pathways previously implicated in anxiety (Supplementary Table S2), including 13 pathways/gene sets that were related to the neuronal system (with 381 unique genes), 5 to brain function/development (94 unique genes), 5 to behavior (95 unique genes) and 1 to transcription factors (93 unique genes). In addition, we identified one ontology term related to aging (54 unique genes)[21-26]. Although there may be some level of false positives from the separate studies, we hypothesize that the majority of these literature reported genes, especially the ones that were identified from significantly enriched pathways, should be functionally linked to anxiety.
Moreover, when the members of a gene set exhibited strong cross-correlation, PEA can boost the signal-to-noise ratio and make it possible to detect modest changes in individual genes[27]. The LNCA analysis showed that many of the frequently reported genes relating to anxiety were functionally associated with one another (Fig 2a), supported by thousands of scientific articles. Furthermore, PNCA results confirmed this observation and showed that 526/592 nodes presented a strong connectivity with each other (average node degree: 135.5 edges). The results indicated that these functionally linked genes possessed a higher likelihood as true discoveries than that of just noise (false positives) as it was less likely that the gene network as a whole was falsely perturbed[27].
In addition to PEA, we performed a sub-network enrichment analysis in order to relate the anxiety associated genes with other diseases in an unbiased fashion. The SNEA results demonstrated that many of the 592 genes (>70%) were also identified as genes associated for other mental disorders (i.e. Schizophrenia, Major Depressive Disorder, Bipolar Disorder) emphasizing the importance of these genes functionally associated with anxiety.
For each node of the anxiety genetic network, we proposed 4 metric scores as node attributes to evaluate their significance in terms of: 1) publication frequency (RScore), 2) novelty (AScore), 3) number of associated anxiety candidate pathways (PScore), and 4) network centrality (SScore). Using the proposed quality metrics scores, it was possible to rank the genes according to different criteria/significance and pick the top ones for further analysis (see Supplementary Table S1). Specifically, we observed that 6 genes frequently replicated (with high RScore) also demonstrated high SScore and PScore, such as DRD2, ADORA2A, IL1B, CRH, AVP, CRHR1 (Fig 4b). These genes have an average support of 44.8 ± 25.3 references, and were connected to multiple significantly enriched anxiety candidate pathways (24.3 ± 3.7 pathways). Moreover, these genes exhibited high network centralities (SScore = 2.0 ± 0.2), suggesting that they are important nodes for the entire disease network and likely to be of high biological significance.
Alternatively, there were 13 genes observed in both the high PScore and SScore groups, but not in RScore group. Although these genes were older in terms of AScore (10.4 ± 5.6 years) and were not as frequently replicated (6.9 ± 5.1 references), they played roles within many multiple anxiety candidate pathways (24.9 ± 5.0 pathways) and demonstrated high centrality for the whole network (SScore = 2.0 ± 0.2). For example, the gene DRD1 (dopamine receptor D1; SScore = 2.4), although reported 12 years ago and thus far only 6 references supported its relation with anxiety, was linked to 526/592 genes and played roles within 38 significantly enriched anxiety candidate pathways, many of which have been implicated with anxiety including; synaptic transmission (0007268), signal transduction (0023033), synaptic transmission, dopaminergic (0001963), signal transducer activity (0009369), memory (0007613), learning(0007612), behavioral fear response (0001662)[21-25]. These observations suggested that these genes may play significant roles in the pathogenic development of anxiety and are thereby worthy of further studying the context of anxiety disease pathology.
Through the anxiety-drug relation data study, we showed that the majority of these drugs (548/618) regulate most of the anxiety candidate genes (538/592), supported by over 100,000 references (Supplementary Table S7b). Moreover, a large portion of the anxiety candidate genes (437/592) have at least one relation with each of the 65 clinically tested anxiety drugs (Supplementary Table S8). Our results help to understand the underlying mechanisms and biological processes of anxiety and support the hypothesis that the majority of the 592 anxiety gene pool identified plays a role in the pathogenic development of anxiety. For example, Through the anxiety-drug relation data study, we showed that the majority of these drugs (548/618) regulate most of the anxiety candidate genes (538/592), supported by over 100,000 references (Supplementary Table S7b). Moreover, a large portion of the anxiety candidate genes (437/592) have at least one relation with each of the 65 clinically tested anxiety drugs (Supplementary Table S8). Our results help to understand the underlying mechanisms and biological processes of anxiety and support the hypothesis that the majority of the 592 anxiety gene pool identified plays a role in the pathogenic development of anxiety. For example, testosterone has shown an anti-anxiety effect with an unclear mechanism[31]. However, our study showed that testosterone had a total of 748 relations with 232/592 anxiety genes that were related to anxiety (See Supplementary Table S7b), providing supporting information in understanding the anti-anxiety effect of testosterone.
Nevertheless, this present study has several limitations that should be considered in future work. Although the 592 gene-anxiety relation were supported by 2,723 articles, it is still possible that some gene-anxiety associations were not detected from the literature. Additionally, although the proposed metrics help in ranking the genes and selecting the top ones with specific significance, further network analysis using more complex algorithms (e.g., graph theory) may extract additional meaningful features to identify biologically significant genes to the disease.
We conclude that anxiety is a complex disease whose genetic causes are linked to a network composed of a large group of genes. This study provided a comprehensive weighted genetic network with node attributes for anxiety, which can be used as groundwork for further molecular studies in the area.
Drs. Chris Cheadle and Hongbao Cao work for Elsevier the ownwers fo the Pathway Studio software and associated databases.
This research did not receive any specific grant from funding agencies in the public, commercial, or not-for-profit sectors.
1.
2.
3.
4.
5.
6.
7.
8.
9.
10.
11.
12.
13.
14.
15.
16.
17.
18.
19.
20.
21.
22.
23.
24.
25.
26.
27.
28.
29.
30.
31.
Liao J, Rao V. Literature Data-mining Analysis Reveals the Genetic Network Underlying Anxiety Disorder. J Psychiatry Brain Sci. 2016;1(3):4; https://doi.org/10.20900/jpbs.20160013

Copyright © 2020 Hapres Co., Ltd. Privacy Policy | Terms and Conditions


