Location:Home >> Detail
Med One. 2016; 1: e160024. https://doi.org/10.20900/mo.20160024

1 Department of Oncology, the Affiliated Hospital of Chengde Medical University, Chengde, Hebei 067000, P.R. China
2 Department of Respiratory, People's Hospital of Tongling, Tongling, Anhui 244000, P.R. China
3 Department of Bioinformatics and Computational Biology, MD Anderson Cancer Center, University of Texas, Houston, TX 77054, USA
* Correspondence: Shaolong Cao, Department of Bioinformatics and Computational Biology, University of Texas, MD Anderson Cancer Center, Houston, TX 77054, USA. Tel: 504-453-5259.
Background: Lung cancer is the most common human cancer. There are numerous studies that have sought to discover genetic impact factors associated with it. The study reported on in this article is a systematic search for the genetic networks underlying the Lewis lung carcinoma (LLC) model.
Methods: LLC-Gene relation data were extracted from the ResNet 11 Mammalian database, containing 175 LLC candidate genes (nodes). Pathway Enrichment Analysis, Sub-Network Enrichment Analysis, Network Connectivity Analysis, and Network Metrics Analysis were conducted to study network attributes and select the top nodes (genes). LLC-Drug and Drug-Gene relation data examined LLC-Gene relations at the small molecule level.
Results: A total of 166 of 175 genes that were enriched in 134 LLC candidate pathways (p < 1e-07), demonstrated strong gene-gene interactions. Metrics analysis revealed 4 genes, IL6, TNF, VEGFA, and HIF1A, as top LLC candidates as measured by replication frequency, network centrality, and functional diversity. Additionally, 169 of 175 LLC candidate genes demonstrated strong interactions with 213 of 253 LLC effective drugs which supports an LLC-gene relationship.
Conclusion: The results suggest that LLC genetic causes link to a genetic network composed of a large number of genes. This network, together with literature and enrichment metrics provide a foundation for further biological/genetic studies in the field.
Lewis lung carcinoma is a tumor named after its 1951 discoverer, Dr. Margaret R. Lewis, of the Wistar Institute. Worldwide lung cancer is the most common human cancer measured by incidence and mortality [1]. LLC cells were utilized to illuminate underlying mechanisms of drug-mediated antitumor activity [2]. Recently, an increasing number of articles have been published. They report over a hundred genes relate to the disease.
Significantly decreased HIF1A expression levels has been suggested by many independent studies to associate with LLC [3]. The IL-6 family is highly up-regulated in many cancers and considered as one of the most important cytokine families during tumorigenesis and metastasis [4]. Modulating the balance between VEGFA and TSP-1 can transiently improve anti-tumor efficacy in LLC [5].
We have found no systematic evaluation of the quality and strength of these reported genes as a functional network/group that has been used to study the underlying biological processes of LLC. This study looked to discover any comprehensive genetic networks underlying disease pathogenesis. It was hypothesized that candidate LLC genes functionally link to each other, and play roles as a network of multiple pathways influencing LLC pathogenesis.
The study structure is as follows: 1) a disease-gene relation data analysis to identify LLC candidate genes; 2) a node enrichment analysis to study LLC pathogenic significance and identify LLC candidate pathways; 3) a gene-gene interaction (GGI) analysis to test functional associations between the genes; 4) a metrics analysis to generate node attributes and identify top nodes; and, 5) an LLC-drug-gene relation data analysis to study relationships at the small molecule level.
2.1 Acquisition of LLC-gene relation dataLLC-gene relation data were acquired from Pathway Studio, Mammalian database updated August 1, 2016. Identified genes were used as the candidate network nodes. ResNet® Mammalian database is a part of PS ResNet Databases, a group of real-time updated network databases that includes curated signaling, cellular process and metabolic pathways, ontologies and annotations, as well as molecular interactions and functional relationships extracted from the 35M+ references covering the entire PubMed abstract and Elsevier full text journals. The databases can be used for data mining and pathway building. The full ResNet Databases include Plant database, and Targeted database. ResNet® Mammalian database is updated weekely and contains information for more than 6,600,000 functional relationships in humans, rats, and mice, which are linked to original literature sources. Entities in the database include: 1) 142,110 proteins; 2) 106,732 small molecules; 3) 8863 cell processes; 4) 15,911 diseases; 5) 5,038 functional classes; 6) 4,387 Clinical parameters; 7) 559 complex; and, 8) 767 cells. http://pathwaystudio.gousinfo.com/ResNetDatabase.html.
2.2 Identification of LLC candidate pathwaysA pathway enrichment analysis (PEA) was performed to identify candidate LLC pathways in order better understand any underlying functional profiles and any pathogenic significance of the genes. In PEA, a Fisher-exact test is employed to test the hypothesis that a gene set with same number of genes could reach the same, or a higher, overlap with the tested pathways. A PEA was performed against a pathway database containing more than 2,000 manually-curated PS-genetic pathways. The various pathways included: cell processes, expression target, immunological, inflammation, metabolic, nociception, signaling, and toxicity, pathways. In addition, results were compared with the entire GO database and the pathway studio ontology database.
A sub-network enrichment analysis (SNEA) was conducted [6]. SNEA is similar PEA in that a given gene set is compared to the sub-networks pre-defined within the Pathway Studio ResNet Database. A SNEA was performed, using all LLC-candidate genes against diseases related sub-networks, in order to identify diseases sharing a genetic basis with LLC.
2.3 Gene-Gene Interaction analysisLiterature and pathway-based GGIs were conducted to study associations between AD candidate genes. The literature-based GGI (LGGI) was performed using Pathway Studio, which identified connectivities between given genes/proteins. Edge weight from an LGGI is the number of references underlying a reported gene-gene relation. The pathway-based GGI (PGGI) analysis was conducted using identified candidate pathways. Edge weight is the number of pathways that include both nodes/genes.
2.4 Metrics analysisThere are 4 attributes for each node, including 2 literature-based metric scores (RScore and AScore), and 2 enrichment-based metric scores (PScore and SScore) propsed for the gene-gene network built through these steps.
These metrics are proposed based on the reasoning that if a gene is linked to LLC with high probability if it meets the following conditions: (1) it has frequently been associated with LLC (high RScore), in independent studies; (2) it plays roles within multiple pathways associated with LLC (high PScore); and, (3) it demonstrates strong functional linkages to many other genes associated with LLC (high SSCore). An AScore, i.e., age score, is proposed to represent the history of each LLC-gene relation and the discovery novel genes (e.g., AScore = 1 for the genes identified in this year, 2016).
2.5 Two literature metricsThe reference number underlying a gene-disease relationship as gene reference score (Rscore) Shown here in Eq. (1).
RScore = The number of references underlying a relationship (1)
The earliest publication age of a gene-disease relationship is the gene age score (Ascore). Shown here in Eq. (2).
AScore = max1≤i≤n ArticlePubAgei (2)
where n is the total number of references supporting a gene-disease relation, and
ArticlePubAge = Current date - Publication date + 1 (3)
2.6 Two enrichment metricsGiven that a disease is associated with a set of genetic pathways ℛ, pathway score (PScore) is defined as the number of pathways containing the kth gene.
PScorek =The number of path ways from ℛ including the kth gene (4)
Node network significance score (SScore) is defined as the normalized centrality of the node within a network. Shown in Eq. (5).
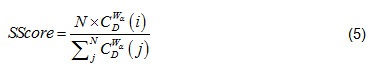
where N is the total number of nodes within a network; is the generalized centrality of the ith node [7]. Defined in Eq. (6).
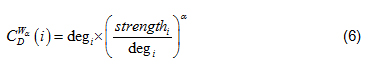
deg is the Freeman formalized node degree centrality [8]. Defined in Eq. (7).
where N is the total number of nodes, i is the focal node, and j represents all other nodes; x is the adjacency matrix, in which the cell is 1 if node i and j are connected, or 0 if not. Note: For network edges built by PNCA, CD∈ [0, N].
Strength in Eq. (6) is node strength [9], defined as the sum of weights of node direct ties, i.e.:
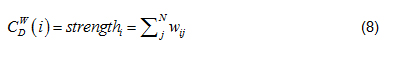
where w is the weighted adjacency matrix. The cell is greater than 0 if the node i is connected to node j, and its value represents tie weight. For network edges built using PNCA, CDW∈[0, N*M], where M is the total number of candidate pathways.
In Eq. (5), when 0 < α < 1, high degree and strong ties are both favorably measured, when α values are greater than 1, lower degrees and stronger ties are favorably measured [7]. In this study, α = 0.5, such that node degree and node strength are equally evaluated.
2.7 Validation at small molecule levelIt was hypothesized that significant LLC candidate gene regulation contributes to disease treatment, and that these candidate genes might present upstream regulation relations with drugs that are effective in treating LLC. LLC-Drug and Drug-Gene relation data were extracted and analyzed from Mammalian database to test potential relationships between LLC candidate genes and effective LLC medications.
All medications within the relation data sets have been shown as effective in treating LLC and all genes have been identified as LLC-candidate genes using LLC-Gene relation data. Related supporting data appear in Supplementary Table S6a-S6e.
LLC-gene relation data revealed 175 LLC candidate genes, supported by 256 references. The full gene list, and related information, including metric scores and related pathways appear in Supplementary Table S1a. The 256 supporting references appear in Supplementary Table S1b, including AD-gene relation types, reference titles, and sentences where an AD-gene relationship was identified. Genes with ‘m_*’ and ‘r_*’ represent mice and rat genes respectively.
A total of 175 genes were associated, in some fashion, with LLC. The ranking by change type is as follows: 103 (58.86 %) with a regulation relationship; 23 (13.14 %) genetic; 43 (24.57 %) quantitative; and, 7 (4.00 %) with state. A total of 15 (8.57 %) were reported to have multiple relationships with the disease. A total of 160 (91.43 %) presented 1 type of relationship to LLC, while 15 (8.57 %) presented 2 (Fig. 1 (a)). (‘Relations: Definitions and Annotations’ section at http://pathwaystudio.gousinfo.com/ResNetDatabase.html.)
The publication date distributions for the underlying 256 articles supporting a gene-LLC relationship appear in Fig. 1 (b). Novel genes reported in each year appear in Fig. 1 (c). As of the date of this article these articles have a 6.3 year average publication age of only 6.3 years, indicating that most were recently published. An analysis showed that publication date distributions for the articles underlying the 175 genes are similar to that presented in Fig. 1 (b).
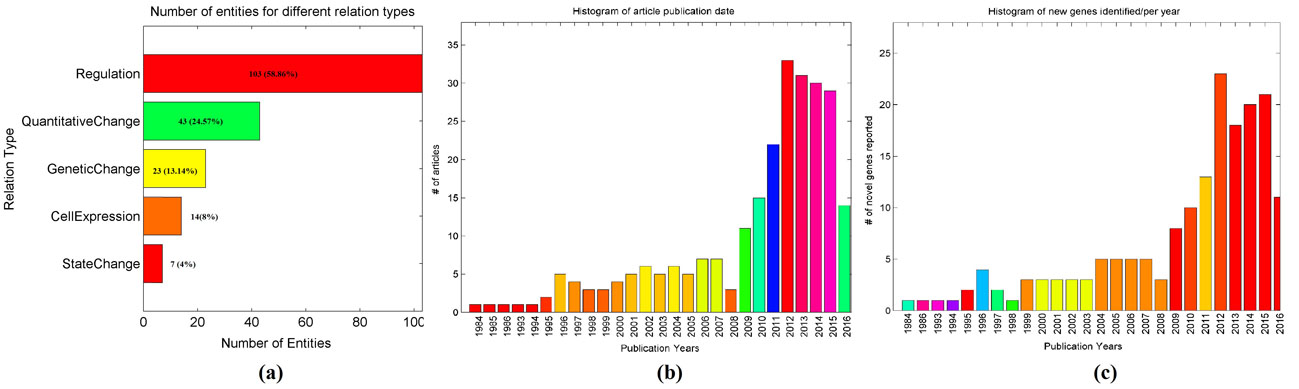 Fig. 1 Histogram of publications reporting gene-disease relationships between LLC
and 175 genes.
Fig. 1 Histogram of publications reporting gene-disease relationships between LLC
and 175 genes.
(a) Genes by different relationship types; (b) Article publications by year; (c) Number of newly-discovered genes by year.
Of these 175 genes, 11 genes were reported as newly-discovered in 2016 and have an ASocre = 1. Table 1 lists the top 11 genes with the highest Rscore (in descending order). Complete results appear in Supplementary Table S1a.
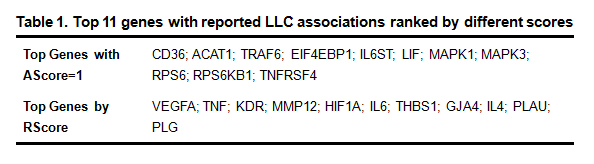 Table 1. Top 11 genes with reported LLC associations ranked by different scores
In this section, PEA and SNEA results for all 175 genes are presented. The complete list appears in Supplementary Table S2a.
Pathway Studio was used to perform an SNEA in order to identify any pathogenic significance of the reported genes to other disorders potentially related to LLC. The top 126 results p-value < 1e-50 (FDR corrected, q = 0.005) appears in Supplementary Table S3a. Table 2 presents the top 10 pathways/groups enrichment analysis results and the top 10 Sub-networks enrichment analysis results by the 175 genes.
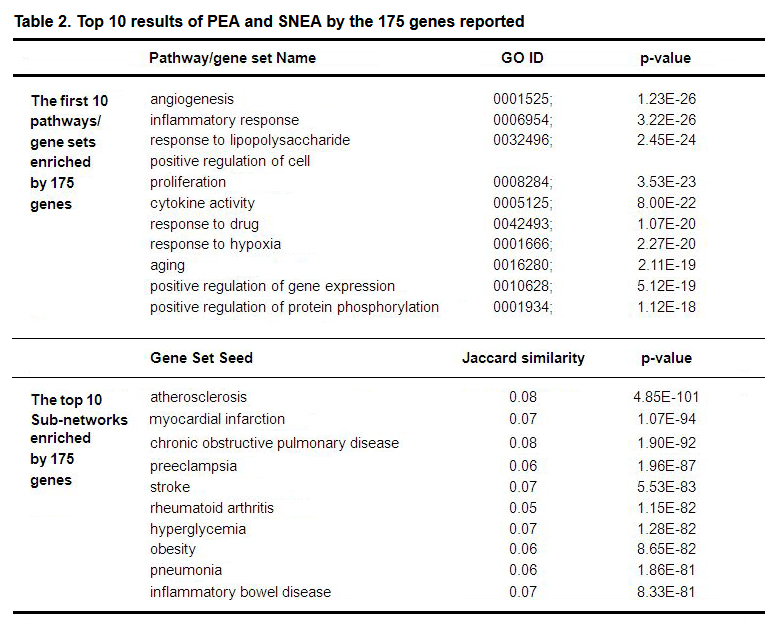 Table 2. Top 10 results of PEA and SNEA by the 175 genes reported
Each pathway/gene set p-value was calculated (q = 0.005 for FDR correction) using one-tailed Fisher-exact test against the hypothesis that the gene set tested was not associated with the corresponding pathway/gene set.
LGGI and PGGI were performed to generate two network types having the identical nodes but different weighted edges. LGGI is literature-based while PGGI is pathway-based. LGGI was used to test possible gene-gene interactions with literature reports. Building pathway scores (PScore) and pathway-based network significance scores (SScore) was based on PGGI.
3.3 LGGI analysisLGGI was performed on the top 11 genes having the highest Rscores and AScores (Table 1) to generate gene-gene interaction networks. There were 83 connections among the 11 RScore group genes (Fig. 2(a)). AScore group genes showed only 44 relations among 11 genes (Fig. 2(b)). This observation is consistent with PEA and SNEA, suggesting that genes with the smallest AScore are not as functionally close to each other as were those from the RScore group.
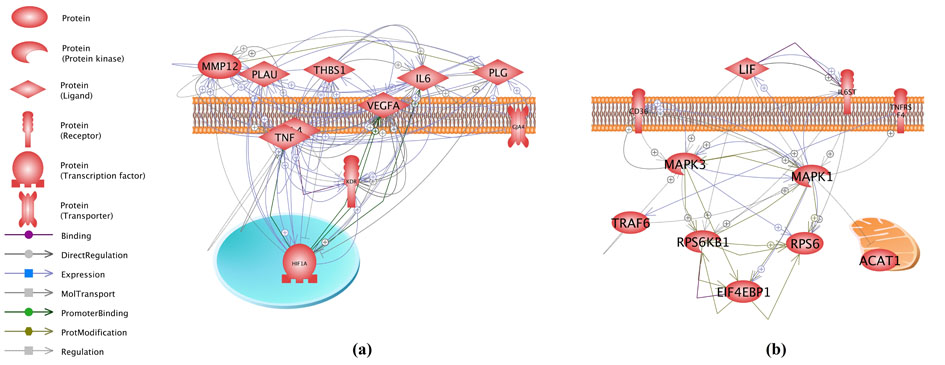 Fig. 2 Connectivity networks built using 11 genes from different groups.
Pathway Studio generated the networks.
PGGI showed that, of the 175 genes (network nodes), there were 6,886 edges connecting 166 genes with 9 genes connected to no other nodes (Supplement Table S4). Average network node strength (sum of the adjacent edge weights) was 122.28. Node strength for the 9 unconnected genes was indicated with a “0”. Fig. 3(a) and Supplement Table S5 present the network adjacency matrix of the genetic network built from the 166/175 genes.s
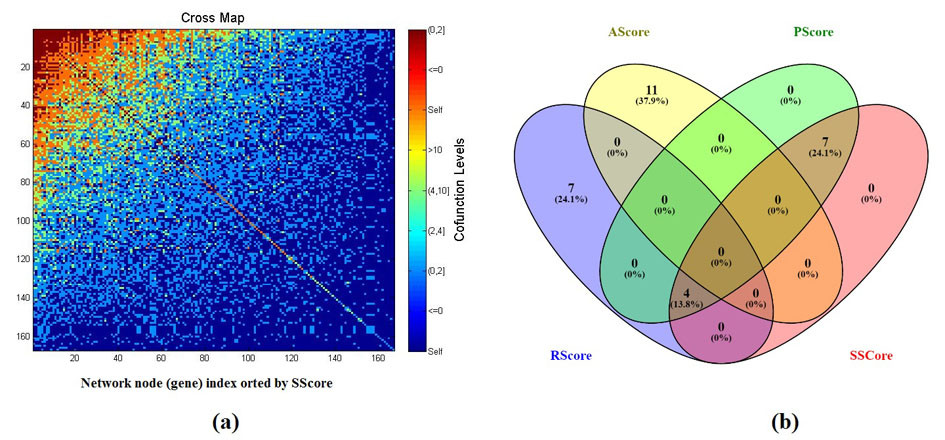 Fig. 3 Comparison of different metrics ranking the 175 genes.
(a) Adjacency matrix of the genetic network built with the 166/175 genes as nodes and PGGI generated weights; (b) A Venn diagram of top 11 genes selected by different metrics.
Two biological metric pathway scores, a (PScore) and a network significance score (SScore), for each gene using the PGGI-built network (Supplementary Table S1a). PScore values represented the numer of LLC candidate pathways involved with the node. An SScore showed node significance to the network. A cross-analysis of the top 11 genes selected using different scores was conducted to study the relationship between the two enrichment metrics and the two literature metrics. A Venn diagram (Fig. 3(b)) was generated (Oliveros, 2007-2015). There was a strong overlap between PScore and SScore (11/11). These 11 genes are the ones that related to the most significantly-enriched pathways. Of these 11 genes, 4 were identified to be an SScore, Pscore, and RScore groups overlap. They include IL6, TNF, VEGFA, and HIF1A, with an RScore = 6.25 ± 2.63 refrences, a PScore = 50.75 ± 10.69 pathways, and an SScore = 2.64 ± 0.33.
There were 7 genes in both the PSCore group and the SScore group, which were not in the RScore group. They are: TGFB1, CCL5, CCL2, PDGFB, PTGS2, SERPINE1, and MMP9. These genes play roles within many significant disease pathways (42.43 ± 5.97 pathways), and demonstrate strong network centrality (SScore = 2.38 ± 0.18). They were old (ASocre: 5.14 ± 3.76 years) were not frequently replicated (1.29 ± 0.49 references), our results suggest that they merit further study.
No overlap between the AScore group and any other group was identified which suggests that these novel LLC candidate genes are supported by fewer studies, and link less to LLC candidate pathways and genes. This observation is consistent with the PEA and SNEA.
3.6 Support from LLC drug studyA study of the LLC-Drug relation data showed there were 255 drugs proven to be effective in treating LLC and this is supported by 422 studies (see Supplementary Table S6a).
The Gene-Drug relation study showed more than 2000 relations connecting 169 out of 175 LLC candidate genes and 213 out of 255 LLC drugs, supported by more than over 20K references (Supplementary Table S6b). The 6 unrelated genes include MIR511, MIR545, IL27RA, CCDC88A, ND6, and DESI2. It was observed that there were 11 genes from the RScore group which presented over 1000 relations with 191/255 LLC drugs and supported by more than 15K references (Supplementary Table S6c). The 11 genes from the AScore group presented 539 relations with 151/255 LLC drugs which was supported by more than 5,798 references (Supplementary Table S6d). The top 1,000 Gene-Drug relations are presented in in Fig. 4.
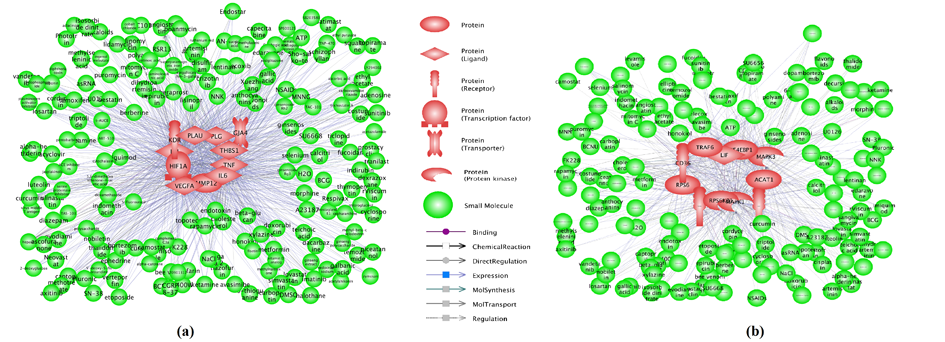 Fig. 4 LLC-effective drugs and their relation with candidate-LLC genes.
(a) The top 1,000 relations between the 191 medications and 11 genes from the RScore group; (b) The 539 relations between the 151 medications and 11 genes from the AScore group.
Lung cancer risks are believed to arise from large genetic networks. In many studies, LLC cells were utilized experimentally to explain the underlying mechanisms of drug-mediated antitumor activity of lung cancer. Results from this study revealed a complex genetic network underlying the LLC pathogenesis. Network node (gene) and edge (gene-gene interaction) attributes were studied and presented. Small molecular level support identified from LLC-Drug and Drug-Gene relation data analysis acquired from Mammalian database was performed.
PEA results showed that most LLC-candidate genes identified included in the pathways were previously implicated with LLC (Supplementary Table S2a). This included: 2 pathways related to the immune system (with 55 unique genes); 5 pathways related to medication effects (62 unique genes); 5 pathways related to cell apoptosis (71 unique genes); 11 pathways related to cell growth and proliferation (88 unique genes); 4 pathways related to protein phosphorylation (37 unique genes); 5 pathways related to protein kinase (38 unique genes); and one ontology term related to aging (26 unique genes) [10-17]. Recognizing the possibility of false positives from the separate studies, we hypothesize that the majority of these literature-reported genes, especially those identified from significantly enriched pathways, should be functionally linked to LLC.
LGGI analysis showed that many of the frequently reported genes related to LLC were functionally associated with one another (Fig 2). This analysis was supported by thousands of references. PGGI results confirmed the observation and showed that 166/175 nodes presented strong connectivity with each other (average node degree: 41.48 edges). The results indicated that these functionally-linked genes possessed higher opportunities as true discoveries than that mere noise (false positives) [18].
SNEA was performed to provide higher levels of confidence when interpreting experimentally-derived genetic data against the background of previously published results (Pathway Studio Web Help). SNEA results demonstrated that over 70 % of the 175 genes [19] also identified as causal genes for other lung cancer-associated disorders.
For each LLC genetic network node, 4 metric scores are proposed as node attributes to evaluate their significance in terms of: 1) publication frequency (RScore); 2) novelty (AScore); 3) number of associated LLC candidate pathways (PScore); and, 4) network centrality (SScore). Using these metrics scores, we were able to rank the genes according to different needs/significance and identify the top ones for further analysis (Supplementary Table S1a). There were 4 genes that frequently replicated (with high RScore) tht also demonstrated high SScore and PScore, such as IL6, TNF, VEGFA, and HIF1A (see Fig. 3(b)). These genes have an average support of 6.25 ± 2.63 references, and are connected to multiple, significantly-enriched LLC candidate pathways (50.75 ± 10.69 pathways). These genes present the highest network centralities (SScore = 2.64 ± 0.33), suggesting that they are important disease network nodes and are likely to pose biological significance.
There were 7 genes observed in in both the PScore group and the SScore group, but not in the RScore group. Although these genes were older, in terms of AScore (5.14 ± 3.76 years) and frequently replicated (1.29 ± 0.49 references), they played roles within multiple LLC candidate pathways (42.43 ± 5.97 pathways) and demonstrated high centrality to the whole network (SScore = 2.38 ± 0.18). One gene, PTGS2 (SScore = 2.30), although reported 13 years ago and having only 2 references to date supported its relation with LLC, was linked to 166/175 genes and played roles within 35 significantly-enriched LLC candidate pathways. Many of these are implicated with LLC, including: angiogenesis, inflammatory response; ROS in triggering vascular inflammation; response to lipopolysaccharide; positive/negative regulation of cell proliferation; positive regulation of apoptotic process; IL1A expression targets; IL1B expression targets F2 -> STAT1/NF-kB expression targets; PAF expression targets; TLR4/AP-1 expression targets; CXCL12 expression targets; HMGB1 expression targets; TNF/AP-1 expression targets; CD40LG/NF-kB/ELK-SRF/CREB/NFATC expression targets; and, positive regulation of nitric oxide biosynthetic process [11-17, 20-28]. The observations suggest that these genes may play significant roles in LLC pathogenesis and merit further study.
An LLC-medication relation data study (Supplementary Table S6a), showed that the majority of these drugs (213/253) regulate most of the LLC candidate genes (169/173). A showing supported by over 20,000 references (Supplementary Table S6c). Eleven genes from the RScore group presented over 1,000 relations with 191/255 LLC medications, supported by more than 16,145 references (Supplementary Table S6d). The 11 genes from the AScore group presented 539 relations with 151/255 LLC medications, supported by more than 5,798 references (see Supplementary Table S6e).
These results help to understand the underlying mechanisms and biological processes of LLC and support the hypothesis that the majority of the 175 LLC gene pool plays a role in lung cancer pathogenesis. Mitomycin C has shown anti-LLC effects with by unknown mechanisms [29, 30]. This study shows that Mitomycin C presents 34 relations with 34/175 genes that were related to LLC (Supplementary Table S7). These 34 genes regulate LLC pathogenic development. The results provide supporting information for understanding the Mitomycin C anti-tumor effects.
This study has limitations that should be considered in future work. Although the 175 gene-LLC relation is supported by 256 articles, it remains possible that some gene-LLC associations were left undiscovered. Although the metrics helps in ranking genes and selecting the top genes with specific significance, further network analysis using more complex algorithms (e.g., graph theory) and more data sets may extract additional meaningful features to identify biologically significant genes to the disease.
LLC is a complex disease whose genetic causes are linked to a network composed of a large number of genes. This study provided a comprehensive weighted genetic network with node attributes for LLC, which could be used as groundwork for further biological/genetic studies in the area.
The authors declare no conflicts of interest.
This research did not receive any specific grant from funding agencies in the public, commercial, or not-for-profit sectors.
1.
2.
3.
4.
5.
6.
7.
8.
9.
10.
11.
12.
13.
14.
15.
16.
17.
18.
19.
20.
21.
22.
23.
24.
25.
26.
27.
28.
29.
30.
Supplementary File 1: Excel File
Lian X, Yang D, Cao S. A Network-Based, Genetic-Marker Evaluation for Lewis Lung Carcinoma. Med One. 2016 Oct 25; 1: e160024. https://doi.org/10.20900/mo.20160024

Copyright © 2020 Hapres Co., Ltd. Privacy Policy | Terms and Conditions