Location:Home >> Detail
Med One. 2017; 1: e170002. https://doi.org/10.20900/mo.20170002

1 Key Laboratory of Cancer Proteomics of Chinese Ministry of Health, Xiangya Hospital, Central South University, 87 Xiangya Road, Changsha, Hunan 410008, P. R. China
2 Hunan Engineering Laboratory for Structural Biology and Drug Design, Xiangya Hospital, Central South University, 87 Xiangya Road, Changsha, Hunan 410008, P. R. China
3 State Local Joint Engineering Laboratory for Anticancer Drugs, Xiangya Hospital, Central South University, 87 Xiangya Road, Changsha, Hunan 410008, P. R. China
4 The State Key Laboratory of Medical Genetics, Central South University, 88 Xiangya Road, Changsha, Hunan 410008, P. R. China
*Correspondence: Xianquan Zhan, Key Laboratory of Cancer Proteomics of Chinese Ministry of Health, Xiangya Hospital, Central South University, 87 Xiangya Road, Changsha, Hunan 410008, P.R. China. Tel: +86-731-48327905; Fax: +86-731-48327905;
In the era of biological omics, an essential issue is how to mine the important biological information, including important signaling molecule patterns, signaling pathways, molecular networks, and pathway-network systems, from big omic data in combination with phenotype features in a given biological system. An appropriate statistical method and algorithm play central technique-support roles in such a bioinformation-mining process. However, for the statistical results, one must realize the difference and relationship of statistical vs. biological significances in those analysis processes. Statistical significance and biological significance are two different concepts with overlapping of their results. The choice of statistical method and threshold value of statistical significance should be determined by the data type and research goal. A statistically significant result must be reasonably interpreted with corresponding biological processes to decide its biological significance. One must not use statistical significance to kidnap biological significance, and the statistical result is only a reference to determine a biological significance.
The rapid development of biological omics (genomics, transcriptomics, proteomics, peptidomics, and metabolomics) [1,2] and systems biology [3,5] is driving personalized precision medicine [6]. Biological statistics plays a key role in this process to obtain important information from those complicated omics data and phenotype data [7-9]. However, one must realize the difference and relationship between statistical significance and biological significance. This article addresses the importance of biological omics and systems biology, necessity of an appropriate statistical method and algorithm for biological omics data analysis, a real example, and molecular network concept-based statistical consideration and biological significance.
The development of modern molecular medicine is experiencing at least three paradigm shifts (Fig. 1): (i) from macrocosmic view to microcosmic view, which is from anatomy, histology, cytobiolgy, molecular biology, to structural biology. (ii) From traditional single parameter strategy to multi-parameter systematic strategy [1, 2, 10, 11], because a traditional single-molecule biomarker is based on an unrealistic assumption that an increase in the amount of a single compound can unambiguously specify a disease [10]. Whereas, the reality is that cancer is a whole-body disease that alters in different levels of multiple genes, multiple proteins, and multiple metabolites, involves multiple causes, multiple processes, and multiple consequences; No a single molecule, or single signaling pathway is able to resolve all problems of a cancer. (iii) From the same treatment for the same types of disease to personalized/precise treatment, because personalized/individualized variations are involved in the each aspect of healthcare (Fig. 2) [1, 2]: prediction/prevention/assessment of preventive response, early-stage diagnosis/therapy/assessment of therapeutic response, and late-stage diagnosis/therapy/assessment of therapeutic response.
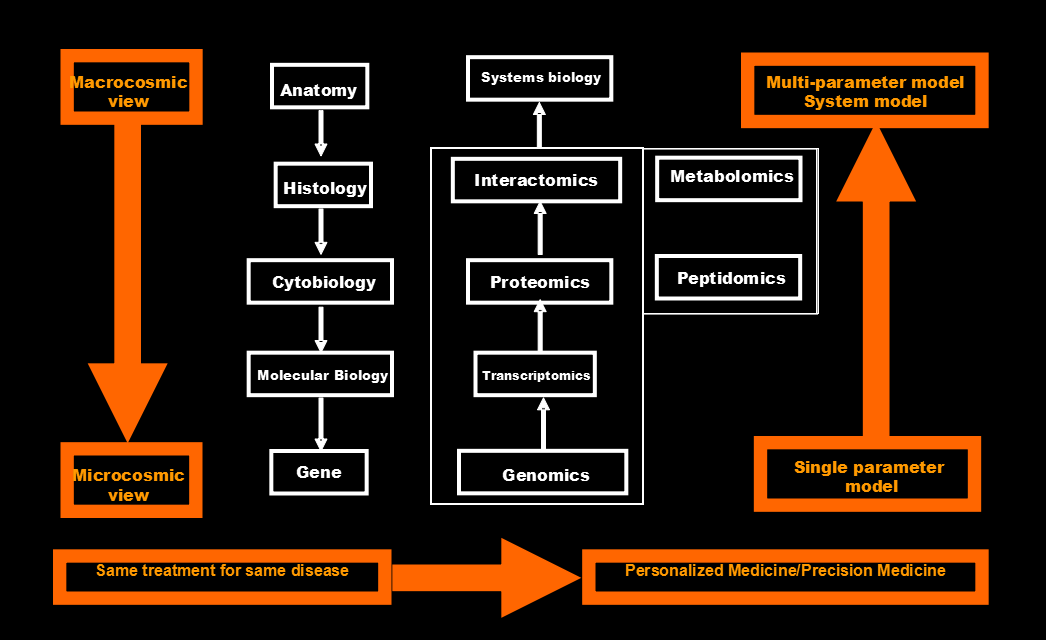 Fig. 1 Three paradigms shift in the field of modern oncology.
 Fig. 2 Personalized variations are involved in each aspect of healthcare.
The paradigm shifts (ii) and (iii) mainly benefit from the rapid developments of omics (genomics, transcriptomics, proteomics, peptidomics, metabolomics, and interactomics) and systems biology together with identification of phenotype including different clinical characteristics (Fig. 3) [2-5, 12, 13]. Furthermore, the genetic central rule (Fig. 4) [14-16] reveals that genome contains 23-pair chromosomes and about 25000 genes with two main approaches (gene sequencing and gene chip) to identify gene mutation, insert, loss, and fusion. Transcriptome contains coding RNAs (mRNAs) and non-coding RNAs (ncRNAs) with two main approaches (sequencing and microarray) [17] to identify variations of gene transcriptions, here splicing variations cause that one gene corresponds to multiple transcripts, which results in that transcriptome is much complicated than genome. Protein is synthesized in the ribosome with the guidance of each transcript. Each protein molecule has multiple copy numbers, and has to translocate to the corresponding location, form specific spatial conformation, and interact with the surrounding molecules, to exert its biological functions. Moreover, lots of post-translational modifications (PTMs) [18, 19] would occur in the processes from synthesized protein to specific location. Those factors, such as protein copy number, splicing, PTMs, translocation, and spatial conformation, result in that proteome is much more complicated than transcriptome and genome [19]. Metabolome contains all metabolites that are derived from sugars, lipids, proteins, and nucleic acids [20]. The variations in metabolome can reflect the mechanism of a biological process and the phenotype characteristics [21].
 Fig. 3 Contributions of omics and systems biology to cancer biology.
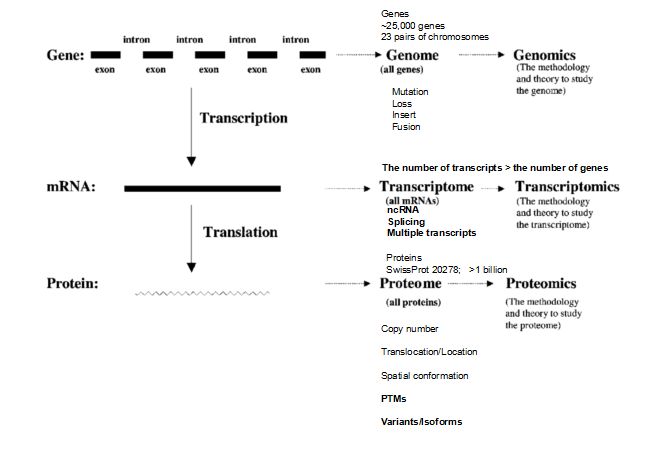 Fig. 4 Relationship among the genome, transcriptome, and proteome in cancer biology.
The large-scale and complicated omics data in combination with different clinical characteristics (Fig. 3 and 4) must be analyzed with appropriate statistical methods to reveal important signal molecule pattern [22], signal pathways, molecular networks, and pathway-network systems [23] that operate in a specific biological system [2, 7]. The choice of an appropriate statistical method depends on the data characteristics and research goal. However, one must realize statistical significance and biological significance in those statistical and biological analysis processes. Statistical significance and biological significance are two different concepts with overlapping of their results. A statistically significant result must be reasonably interpreted with corresponding biological processes to decide its biological significance.
One example was taken below to clarify the statistical consideration and biological significance in the systems biology study. One study [7] was designed to discover statistically significant signaling pathways and networks with pituitary adenoma protein-mapping data [24], comparative proteomic data [25, 26], and nitroproteomic data [27, 29] from Ingenuity Pathway Analysis (IPA) knowledge base (IPAKB) that contains a large-scale scientific findings and many canonical pathways and networks [7]. This study employed the Fisher’s exact test in the IPA program to identify statistically significant pathways or networks with a significance level of 0.05. For this statistical analysis, the null hypothesis (H0) is that proteomic dataset of pituitary adenoma is not associated with all pathway networks that are stored in the IPAKB, the alternative hypothesis (H1) is that the proteomic dataset of pituitary adenoma is associated with all pathway networks in the IPAKB, and the level of significance is set as 0.05. The Fisher’s exact test was used to calculate the p-value to determine the probability that the association between the molecules in the proteomic dataset and the canonical pathway networks that is explained only by chance. The statistically significant result was that when p < 0.05, H0 was rejected, and H1 was accepted, which means that the identified signaling pathway networks exist in the pituitary adenoma. Based on this statistical hypothesis, method, and criteria of statistical significance, this study identified 12 significant canonical pathways (Fig. 5) and 1 network from qualitative nitroproteomic dataset in pituitary adenomas, 12 significant canonical pathways (Fig. 6) and 1 network from qualitative nitroproteomic dataset in controls, 9 significant canonical pathways (Fig. 7) and 3 networks from comparative proteomic dataset, and 37 significant canonical pathways (Fig. 8) and 6 networks from protein-mapping dataset.
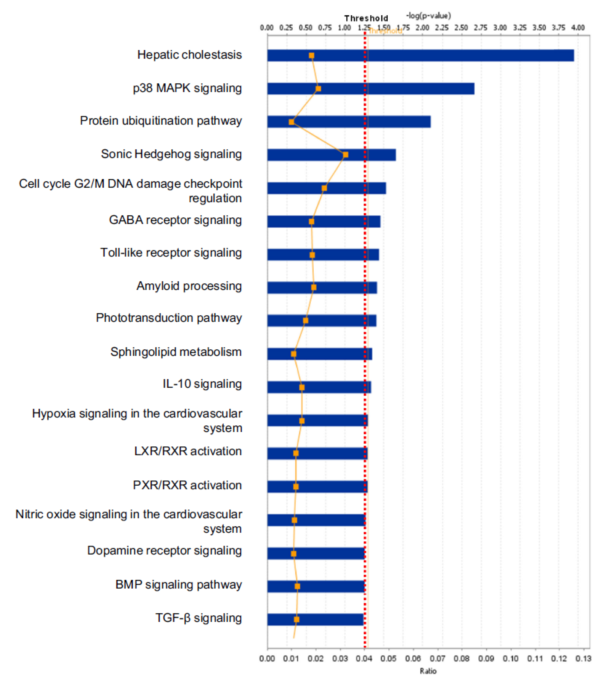 Fig. 5 Significant canonical pathways that are involved with pituitary adenoma nitroproteins.
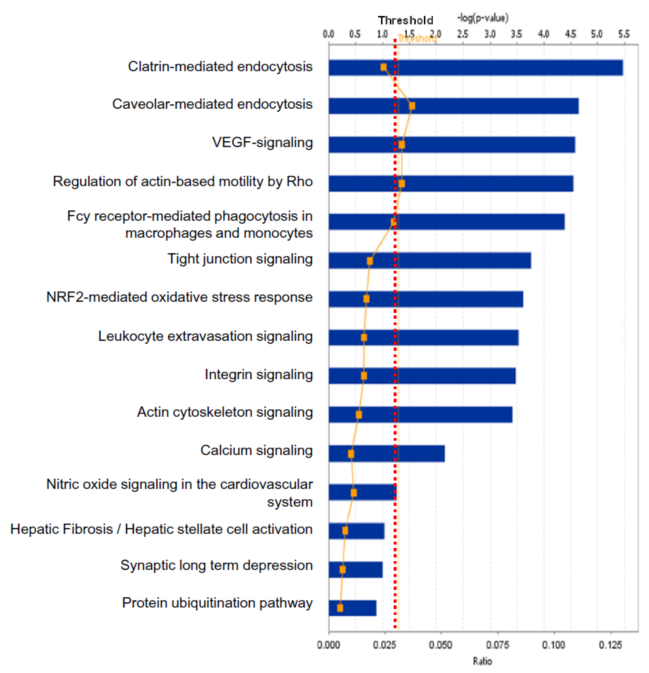 Fig. 6 Significant canonical pathways that are involved with control pituitary nitroproteins.
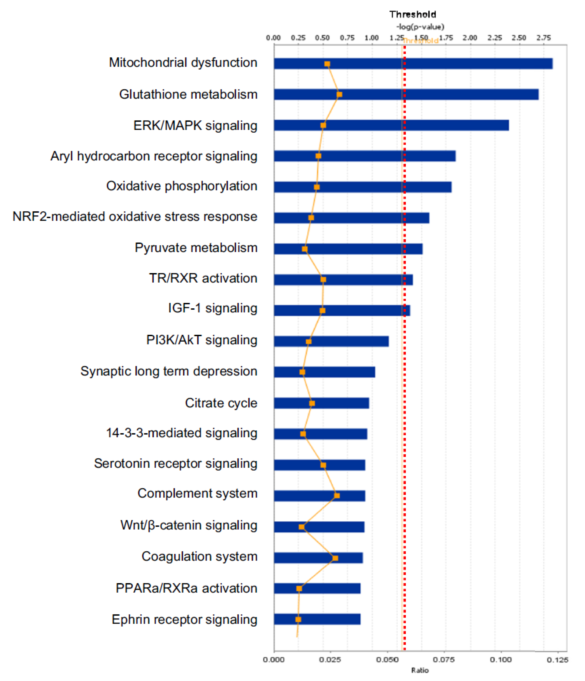 Fig. 7 Significant canonical pathways that are involved with pituitary adenoma comparative-proteomic data.
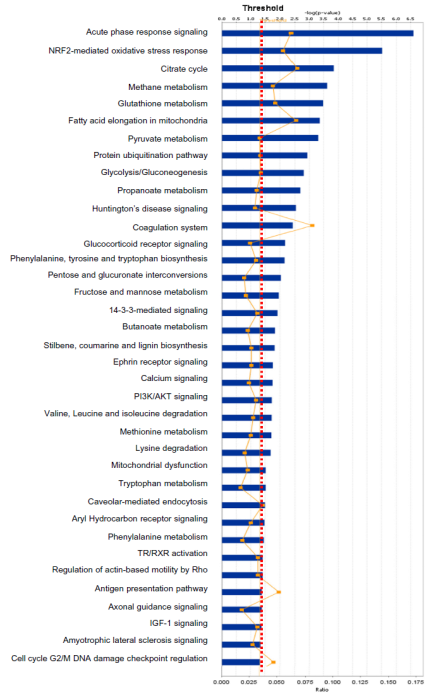 Fig. 8 Significant canonical pathways that are involved with pituitary adenoma protein-mapping data.
In this study, one can clearly find that if the significance level of 0.01 or 0.001 is used, it is more stringent criteria for this type of data analysis. It could decrease the probability of false positives, but it also leads to the loss of some biologically meaningful information. For example, if the significance level of 0.001 [or -log (0.001) = 3] is utilized, then there will be only 1 left significant canonical pathway (Fig. 5) identified from pituitary adenoma nitroproteomic data, 10 significant canonical pathways (Fig. 6) from control pituitary nitroproteomic data, no significant canonical pathways (Fig. 7) derived from comparative proteomics data, and 7 statistically significant canonical pathways (Fig. 8) from the protein-mapping data. As a result, compared to the level of statistical significance p < 0.05, many important canonical pathways (Fig. 5-8) are missing at the level of statistical significance p < 0.01 or 0.001. In fact, many differentially expressed proteins (DEPs) with a biological significance[25, 26] are derived from those important canonical pathways that were missed at the level of statistical significance p < 0.01 or 0.001; and here, the biological significance means the real variations or effects in a biological system. Furthermore, in Fig. 5, more stringent criteria (p < 0.001) would simply result in a significant canonical pathway – hepatic cholestasis. However, this pathway does not have much biological meaning for pituitary adenomas. On the other hand, the canonical pathways p38 MAPK signaling, cell-cycle G2/M DNA damage-checkpoint regulation, and protein-ubiquitination pathways (Fig. 5) were recognized as statistical significance with a significance level of 0.05, which can be reasonably linked to the real pituitary adenoma biological processes.
Any statistically significant result only serves as a reference for biological significance, and must be rationally interpreted with corresponding biological processes to decide its biological significance. Statistical significance does not mean a real variation or effect in a biological system. Some statistically significant results do not have any real biological meaning at al. A typical example is that hemoglobin is often identified as statistically significant DEP between pituitary adenoma and control tissues [25, 26]. However, it cannot be taken as a real DEP or biologically meaningful biomarker for a pituitary adenoma because its statistical significance is probably resulted from residual blood contamination. Another example, the canonical pathway hepatic cholestasis (Figure 5) is ranked top one with a statistical significance, but it does not have any biological effect for pituitary adenoma pathogenesis. Moreover, for some cases, even though there might not be any statistical significance, those molecules still have biological significance. For instance, some genes have only a small change at the mRNA level without any significant difference; however, that small change at the mRNA level could result in an amplified change on the protein level, this result is still an interesting and meaningful finding. Therefore, when a research uses a certain statistical standard and receives corresponding statistical results, one should determine carefully whether the results are biologically relevant or just occur only by chance.
Based on these statistical considerations, those statistically significant pathways and networks identified with the Fisher's exact test with a significance level of 0.05 were reasonably explained within the pituitary adenoma biological system. Four important biological pathways [7] were identified for pituitary adenomas according to these considerations, including mitochondrial dysfunction, oxidative stress, cell-cycle dysregulation, and the MAPK signaling abnormality. These four biological pathways provide important clues and direction for further in-depth studies of pituitary adenomas.
Molecules from genome, transcriptome, proteome, metabolome interact mutually to form an interactome to exert their biological functions in a biological system [30-32], and this interactome is an ideal concept. Molecule networks are an important bridge to reach that interactome. Generally, all molecules are interacted and regulated mutually in the molecule-network system. Relative to the normal status, the altered molecule-network system occurs in a certain condition such as a cancer biological system. Based on the concept of molecular network, several issues are worth considering for statistical vs. biological significances: (i) Hub molecules would play very important roles in the molecule-network system; however, the amount of some hub-molecules would not alter much, and even no significant change in a disease status relative to the normal status. Thus, that hub molecule would do not have statistically significant alteration but have important biological function. A study found that hub-molecules and bottleneck-molecules in molecular networks were changed significantly slower than non-hub and non-bottleneck molecules, that the variation rate of hub-molecules was significantly lower than that of bottleneck-molecules, and that hub-molecules received stronger constraint than bottleneck-molecules [33-35]. (ii) Each comparative omics analysis is commonly to identify differentially expressed genes (DEGs) and proteins (DEPs) with a certain changed fold with a statistical significance [25, 26]. In fact, all molecules with statistical significance and without statistical significance interact mutually in a molecular network system, those molecules without statistical significance might still important in the molecular network system, and furthermore, the level of statistical significance (such as p < 0.05, p < 0.01, or p < 0.001) is determined by researchers during experimental design and before experiments. Thus, many biological information would be lost if one completely relies on statistical significant results. (iii) All molecules with or without differentially expressed molecules are used to establish the corresponding molecule networks [32-36] that will be more representative result between two given conditions compared to that molecular networks derived from only statistically significant changed molecules. A human interactome [36] was constructed to connect 5400 proteins with 28,500 interactions in three quantitative dimensions using stoichiometries and abundances, which revealed that weak interactions dominate the network and have critical topological properties, and that there are rare stable complexes that stand out by a signature of balanced stoichiometries.
It is very complicated and important for statistical consideration and biological significance in a given big data and biological system. One must realize the difference and relationship between statistical and biological significances. The right statistical method must be selected for a given big data. The statistical results must be reasonably explained in a specific biological system. One must not use statistical significance to kidnap biological significance. Statistical significance is not equal to biological significance. Statistical result is only a reference to determine a biological significance.
This work was supported by the National Natural Science Foundation of China (Grant No. 81572278 and 81272798 to XZ), the grants from China “863” Plan Project (Grant No. 2014AA020610-1 to XZ), the Xiangya Hospital Funds for Talent Introduction (to XZ), and the Hunan Provincial Natural Science Foundation of China (Grant No. 14JJ7008 to XZ).
X.Z. conceived the concept, collected pertinent references, designed and wrote the manuscript, and trained Y.L, X.H.Z, and Y.M regarding statistical significance, biological significance, and systems biology. Y.L. and Y.M participated in the collection of references, discussion and modification of manuscript. X.H.Z participated in revision of the manuscript. All authors approved the final manuscript.
The authors declare that there is no conflict of interests regarding the publication of this article.
1.
2.
3.
4.
5.
6.
7.
8.
9.
10.
11.
12.
13.
14.
15.
16.
17.
18.
19.
20.
21.
22.
23.
24.
25.
26.
27.
28.
29.
30.
31.
32.
33.
34.
35.
36.
Zhan X, Long Y, Zhan X, Mu Y. Consideration of Statistical vs. Biological Significances for Omics Data-Based Pathway Network Analysis. Med One. 2017 Feb 21; 1: e170002. https://doi.org/10.20900/mo.20170002

Copyright © 2020 Hapres Co., Ltd. Privacy Policy | Terms and Conditions