Location:Home >> Detail
J Psychiatry Brain Sci. 2016;1(4):2; https://doi.org/10.20900/jpbs.20160016

1 Beijing Huilongguan Hospital, Beijing, China, 100096
2 Department of Bioinformatics, American Informatics Consultant LLC, Rockville, MD, 20852, USA
*Correspondence: Lydia C Manor, Department of Bioinformatics, American Informatics Consultant LLC, Rockville, MD, 20852, USA; Tel: 1-301-760-3429.
Background: It is believed that the genetic cause of complex diseases, such as Eating Disorder (ED), is linked to a large genetic network. In recent years, there has been an increased number of studies reporting dozens of genes associated with ED, posing an increased need of a systematically evaluation of the genetic markers underlying the disease.
Methods: ED-Gene relation data were extracted from the ResNet Mammalian database, containing 69 ED candidate genes. Pathway Enrichment Analysis, Sub-Network Enrichment Analysis, Network Connectivity Analysis and Network Metrics Analysis were conducted to study network attributes and select the top genes for ED. Additionally, ED-Drug and Drug-Gene relation data were employed to study the ED-Gene relation at the small molecule level.
Results: 66 out of 69 genes enriched 104 ED candidate pathways (p-values < 1e-5), demonstrating strong gene-gene interactions. Metrics analysis suggest 6 genes worthy of further study for ED, including CHR, DRD2, AVP, OPRM1, IL6, and ESR2. Additionally, the majority of the ED candidate genes (64/69) demonstrated strong interaction with 46/55 ED effective drugs, providing support for the ED-gene relationships identified.
Conclusion: Our results suggested that the genetic causes of ED were linked to a genetic network composed of a large group of genes. The gene network, together with the literature and enrichment metrics provided in this study, laid the groundwork for further biological/genetic studies in the field.
Eating disorders are mental syndromes characterized by significant disturbances in eating behavior and by distress or excessive concern about body shape or weight. These disturbances not only include alterations in eating patterns and diet choices, but also involve distinct aberrant psychological perceptions towards food, eating, body weight, and body self-image[1]. EDs result in about 7,000 deaths a year as of 2010, making them the mental illnesses with the highest mortality rate[2]. The cause for most of ED's cases is still mostly unknown. While past findings have described the causes of eating disorders as primarily psychological, environmental, and socio-cultural, new studies have uncovered evidence that there is a prevalent genetic/heritable aspect of the causes of ED[3-5]. As such, significant research into the causes are being explored.
Recent years saw an increase in the number of articles reporting genes/proteins related to ED. For example, the enhanced platelet serotonin 5-HTR2A receptor status was suggested as a prognostic marker for ED[6]. Additionally, CCK has been studied in clinical trials for reducing binge eating in people with bulimia nervosa [NCT00308776]. Moreover, other articles have reported quantitative changes of genes in cases of ED. The altered gene expression levels/activities of CRH, OPRM1 were observed in patients with ED[7,8]. To note, many genes were reported to influence the pathogenic development of ED with an unknown mechanism or indirect relationship. For instance, Qureshi, et al. and Kas, et al. pointed out that NPY may potentially contribute to the development of eating disorders[9,10] Gonzalez et al. stated that pro-inflammatory cytokines such as IL-1,IL-6 may play a key role in the pathogenesis of ED[11]. Alternatively, some studies did suggest a functional mechanism of a mutation that can cause ED[12,13].
However, no systematic analysis has evaluated the quality and strength of these reported genes as a functional network/group to study the underlying biological processes of ED. In this study, instead of focusing on a specific gene, we attempted to discover the comprehensive genetic network underlying the pathogenic development of the disease. We hypothesized that ED risk genes were functionally linked to each other, playing roles within multiple genetic pathways influencing the pathogenic development of ED.
We first used ED-Gene relation data to identify ED candidate genes. Then we conducted pathway enrichment analysis (PEA) and sub-network enrichment analysis (SNEA) to identify ED candidate pathways and sub-networks. After that, we performed Gene-Gene Interaction (GGI) analysis to test the functional association between these candidate genes, based on which metrics analysis were proposed to identify top nodes. Last, we employed ED-Drug-Gene relation data to study the ED-Gene relation at the small molecule level.
1. Acquisition of ED-gene relation dataThe ED-gene relation data were acquired from Pathway Studio ResNet Mammalian database updated July 2016. The genes identified will be used as the candidate network nodes. The ResNet® Mammalian database is one part of PS ResNet Databases, a group of real-time update network databases that includes curated signaling, cellular process and metabolic pathways, ontologies and annotations, as well as molecular interactions and functional relationships extracted from the 35M+ references covering entire PubMed abstract and Elsevier full text journals. The databases can be used for data mining and pathway building. The full ResNet Databases also include Plant database, and Targeted database. Updated weekly, the ResNet® Mammalian database contains information for over 6,600,000 functional relationships for human, rat, and mouse, linked to all of their original literature sources. For more information about the PS ResNet Mammalian databases, please refer to http://pathwaystudio.gousinfo.com/ResNetDatabase.html.
2. Identification of ED candidate pathwaysTo better understand the underlying functional profile and the pathogenic significance of the reported genes, a Pathway enrichment analysis (PEA) was performed, through which candidate ED pathways were identified. Additionally, a sub-network enrichment analysis (SNEA) was conducted [14]. SNEA approach is similar to that of PEA, where a given gene set is compared to the sub-networks pre-defined within Pathway Studio ResNet Database. In this study, we performed SNEA using all ED candidate genes against diseases related subnetworks, with the purpose to identify diseases that share a genetic basis with ED. The original Bejnamini & Hochberg FDR procedure[15] was applied for both PEA and SNEA.
3. Gene-Gene Interaction analysisBoth literature and pathway based GGI were conducted to study the associations between the ED candidate genes. The literature based GGI (LGGI) was performed using Pathway Studio, which identified connectivity between given genes/proteins. The weight of an edge from LGGI is the number of scientific references underlying a reported gene-gene relation. The pathway based GGI (PGGI) analysis was conducted using the candidate pathways identified. The weight of an edge is the number of pathways where both nodes/genes were included.
4. Metrics analysisFor the weighted network built through the aforementioned steps, we proposed 4 attributes for each node, including 2 literature based metric scores (RScore and AScore), and 2 enrichment based metric scores (PScore and SScore), which were defined as follows. The proposal of these metrics was based on the logic that, if a gene satisfies the following conditions, it is linked to ED with high probability: 1) Has been frequently observed in independent studies to be associated with ED (high RScore); 2) Plays roles within multiple pathways implicated with ED (high PScore); 3) Is functionally linked to many of other genes that were associated with ED (high SSCore). Additionally, we propose the AScore to present the history of each ED-gene relation and discover novel genes (e.g., AScore = 2 for the genes identified in 2015-2016). The detailed definition of the proposed metrics are described as follows.
4.1 Two literature metricsWe define the reference number underlying a gene-disease relationship as the gene’s reference score (RScore), as shown in Eq. (1).
RScore= The number of references underlying a relationship (1)
We define the earliest publication age of a gene-disease relationship as the gene's age score (AScore) as shown in Eq. (2).
AScore= max1≤i≤n ArticlePubAgei (2)
where n is the total number of references supporting a gene-disease relation, and
ArticlePubAge = Current date - Publication date + 1 (3)
4.2 Two enrichment metricsGiven a disease is associated with a set of genetic pathways ℛ, we then define a pathway score(PScore) as the number of pathways including the gene.
PScorek = The number of path ways from ℛincluding the kth gene (4)
We define a network significance score (SScore) of a node as the normalized centrality of the node within a network, as shown in Eq. (5).

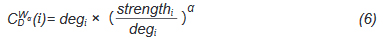
Where N is the total number of nodes within the network;  is the generalized centrality of the ith node,[16] which is defined as Eq. (6).
And deg is the Freeman's formalized node degree centrality[17], as defined as Eq. (7),

Where N is the total number of nodes, i is the focal node, and j represents all other nodes; x is the adjacency matrix, in which the cell xij is 1 if node i and j are connected, or 0 if not. Note: For network edges built by PNCA, CD ∈ [0,N].
And strength in Eq. (6) is the node strength [18], defined as the sum of weights of node's direct ties, i.e.:
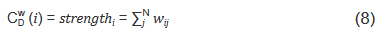
where w is the weighted adjacency matrix. The cell wij is greater than 0 if the node i is connected to node j, and its value represents the weight of the tie. Note, for network edges built by PNCA, CDW∈ [0,N*M], where M is the total number of candidate pathways.
In Eq. (5), when 0 < α < 1, both high degree and strong ties are favorably measured, whereas, for values of α greater than 1, lower degrees and stronger ties are favorably measured[16]. In this study, we set α = 0.5, such that the node degree and node strength were equally evaluated.
5. Validation at small molecule levelWe hypothesize that regulation of significant ED candidate genes contributes to the clinical treatment of the disease, and therefore these candidate genes should present upstream regulation relations with drugs that are effective in treating ED.
To test the potential relationship between ED candidate genes and ED effective drugs, ED-Drug and Drug-Gene relation data were extracted and analyzed from ResNet 11 Mammalian database. All Drugs within the relation data sets have been shown effective in treating ED by preclinical studies or clinical trials, and all genes have been identified as ED candidate genes through ED-Gene relation data. Related supporting data were provided in Supplementary data.
Study on the ED-Gene relation data identified 69 ED candidate genes, supported by 199 references. The full results are listed in Supplementary Table S1a, including the list of all 69 genes, the metric scores and the related pathways, while all the 256 supporting references are listed in Supplementary Table S1b, including ED-gene relation types, reference titles and the sentences where an ED-gene relationship was identified. To note, gene with ‘m_*’ and ‘r_*’ represent genes identified in mouse and rat, respectively.
3.1 Summary of candidate ED genesOf the 69 genes associated with ED, 39 (56.52 %) genes presented Regulation relationship to the disease, 37 (53.62 %) with Genetic Change, 12(17.39 %) with Quantitative Change, 1 (1.45 %) with Biomarker, and 1 (1.45 %) with Clinical Trial. To note, 15 (21.74 %) genes have been reported to have multiple relationships with the disease. Specifically, 54 (78.26 %) genes presented 1 type of relationship to the disease, 9 (13.04 %) with 2, and 6 (8.70 %) with 3, see in Fig. 1 (b). For detailed definition and description of these relation types mentioned above, please refer to the ‘Relations: Definitions and Annotations’ section at http://pathwaystudio.gousinfo.com/ResNetDatabase.html.
Publication date distributions of the underlying 199 articles supporting the gene-ED relationships were presented in Fig. 1 (b), with novel genes reported in each year in Fig. 1 (c). To note, these articles have an average publication age of only 7.6 years, indicating that most of the articles were published in recent years. Additionally, our analysis showed that the publication date distributions of the articles underlying each of the 69 genes were similar to that presented in Fig. 1 (b).
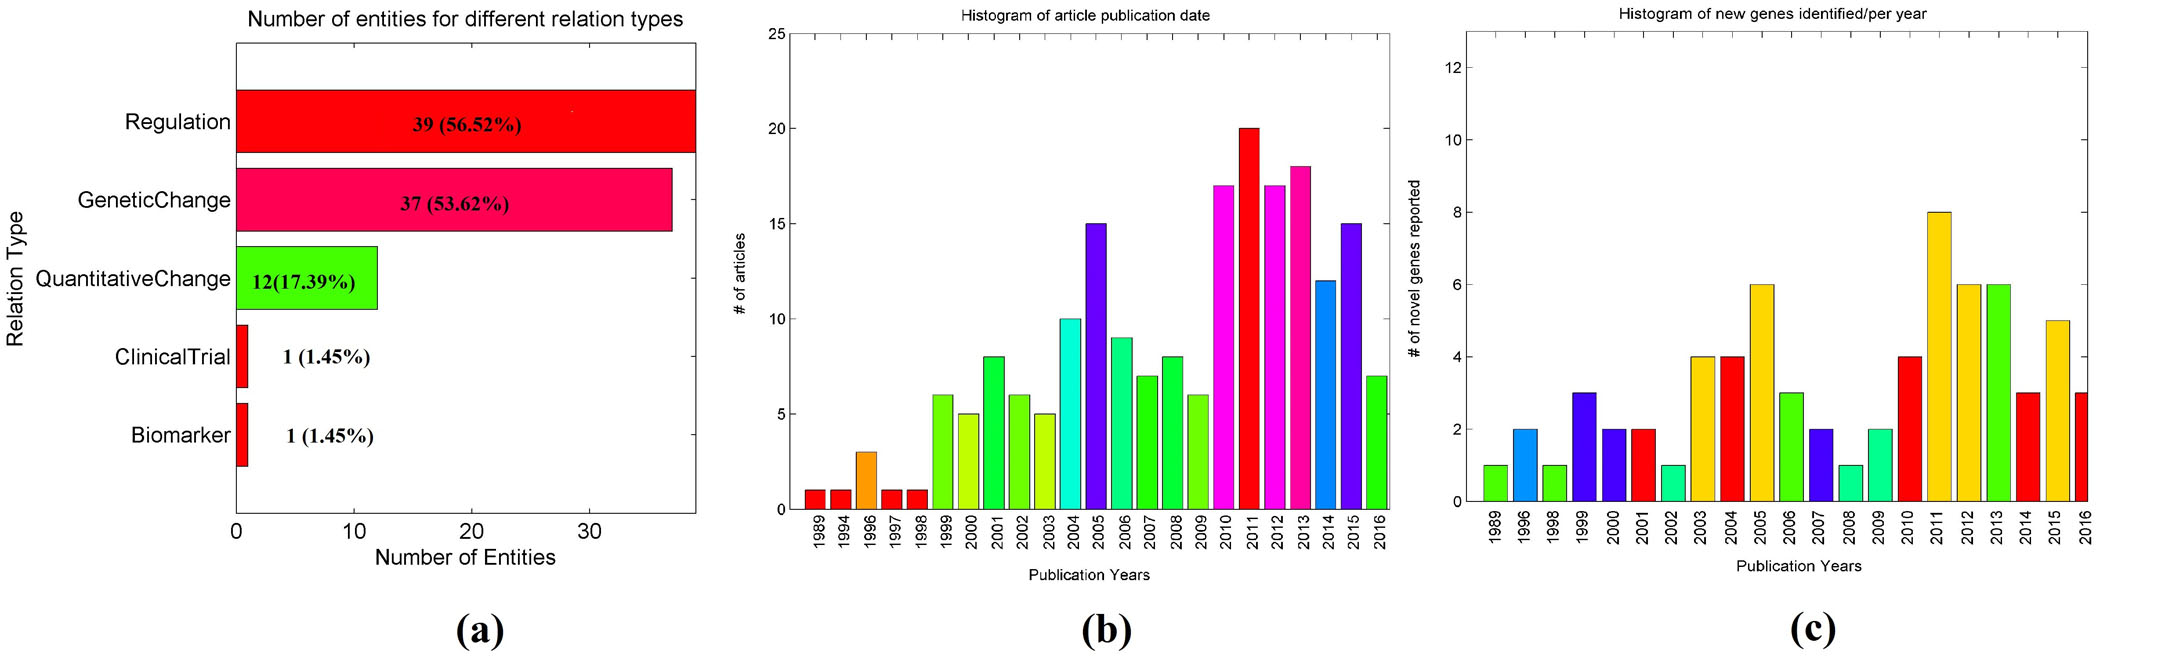 Fig. 1 Histogram of the publications reporting gene-disease relationships between ED and 69 genes. (a) Number of genes for different relation types; (b) number of article publications by year; (c) number of novelty genes identified in each year.
Among these 69 genes, 8 were reported in 2015-2016 with ASocre = 2, which were listed in Table 1. For comparison purposes, Table 1 also listed the top 8 genes with the highest RScore, PScore, SScore (in descend order). Full results were provided in Supplementary Table S1a.
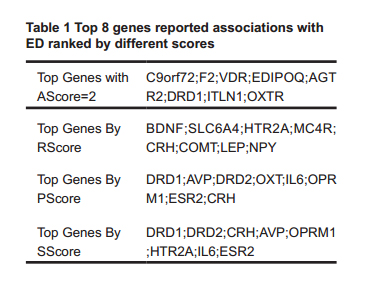 Table 1 Top 8 genes reported associations with ED ranked by different scores
In this section, we presented the Pathway enrichment analysis (PEA) and sub-network enrichment analysis (SNEA) results for all 69 genes.
2.1 Enrichment analysis on all 69 genesAmong these 104 pathways/gene sets enriched, we identified 7 pathways/gene sets that were related to the neuronal system (with 42 unique genes), 1 to neuro transmitter (3 unique genes), 1 to brain function (with 8 unique genes), 6 to behavior (32 unique genes) and 2 to blood pressure (9 unique genes). In addition, we identified one ontology term related to aging (9 unique genes)[19-24]. Due to lack of space, we present only present the top 10 pathways/groups enriched with 66/69 genes (p-values < 1.8e-32) in Table 2, and the full list of 104 pathways/gene sets enriched with 66/69 genes (p-values < 1e-5) has been listed in Supplementary Table S2.
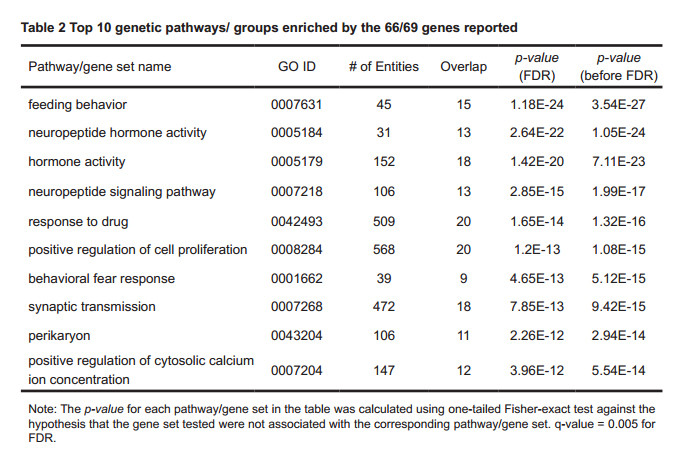 Table 2 Top 10 genetic pathways/ groups enriched by the 66/69 genes reported
Besides PEA, we also performed a SNEA using Pathway Studio with the purpose of identifying the pathogenic significance of the reported genes to other disorders potentially related to ED. The list of the 107 results with p-values < 1e-20 (FDR corrected) was provided in Supplementary Table S3. In Table 3, we present the top 10 SNEA results by the 69 genes. We saw that many of these reported ED related genes were also identified in other mental health related diseases, with a large percentage of overlap.
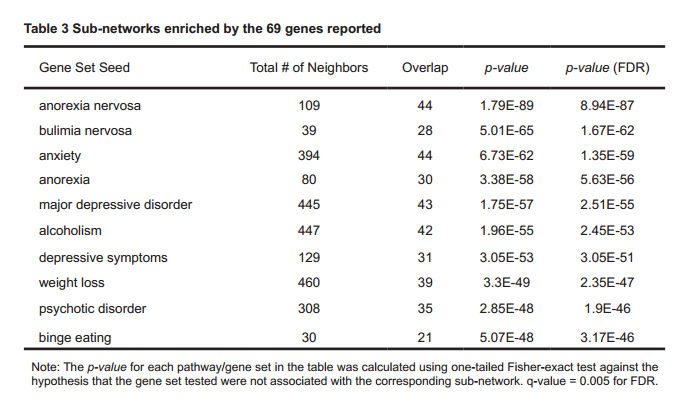 Table 3 Sub-networks enriched by the 69 genes reported
Both LGGI and PGGI were performed to generate two types of networks with the same nodes but different types of weighted edges. To note, LGGI is literature based while PGGI is pathway based. In this study, we used LGGI to test possible gene-gene interactions with literature reports. Building the pathway score (PScore) and the pathway based network significance score (SScore) was based on the PGGI.
3.1 LGGI to test sub-group connectivityWe performed a LGGI on the top 8 genes with the highest RScores and AScores (from Table 1) to generate gene-gene interaction networks. Results showed that, for the RScore group, there were 41 connections among all 8 genes, as shown in Fig. 2 (a), supported by more than 1000 articles. In contrast, genes within the AScore group demonstrated only 10 relations among 7 genes, as shown in Fig. 2 (b), with 1 genes showing no direct relation with other genes in the group (Fig. 2 (b);
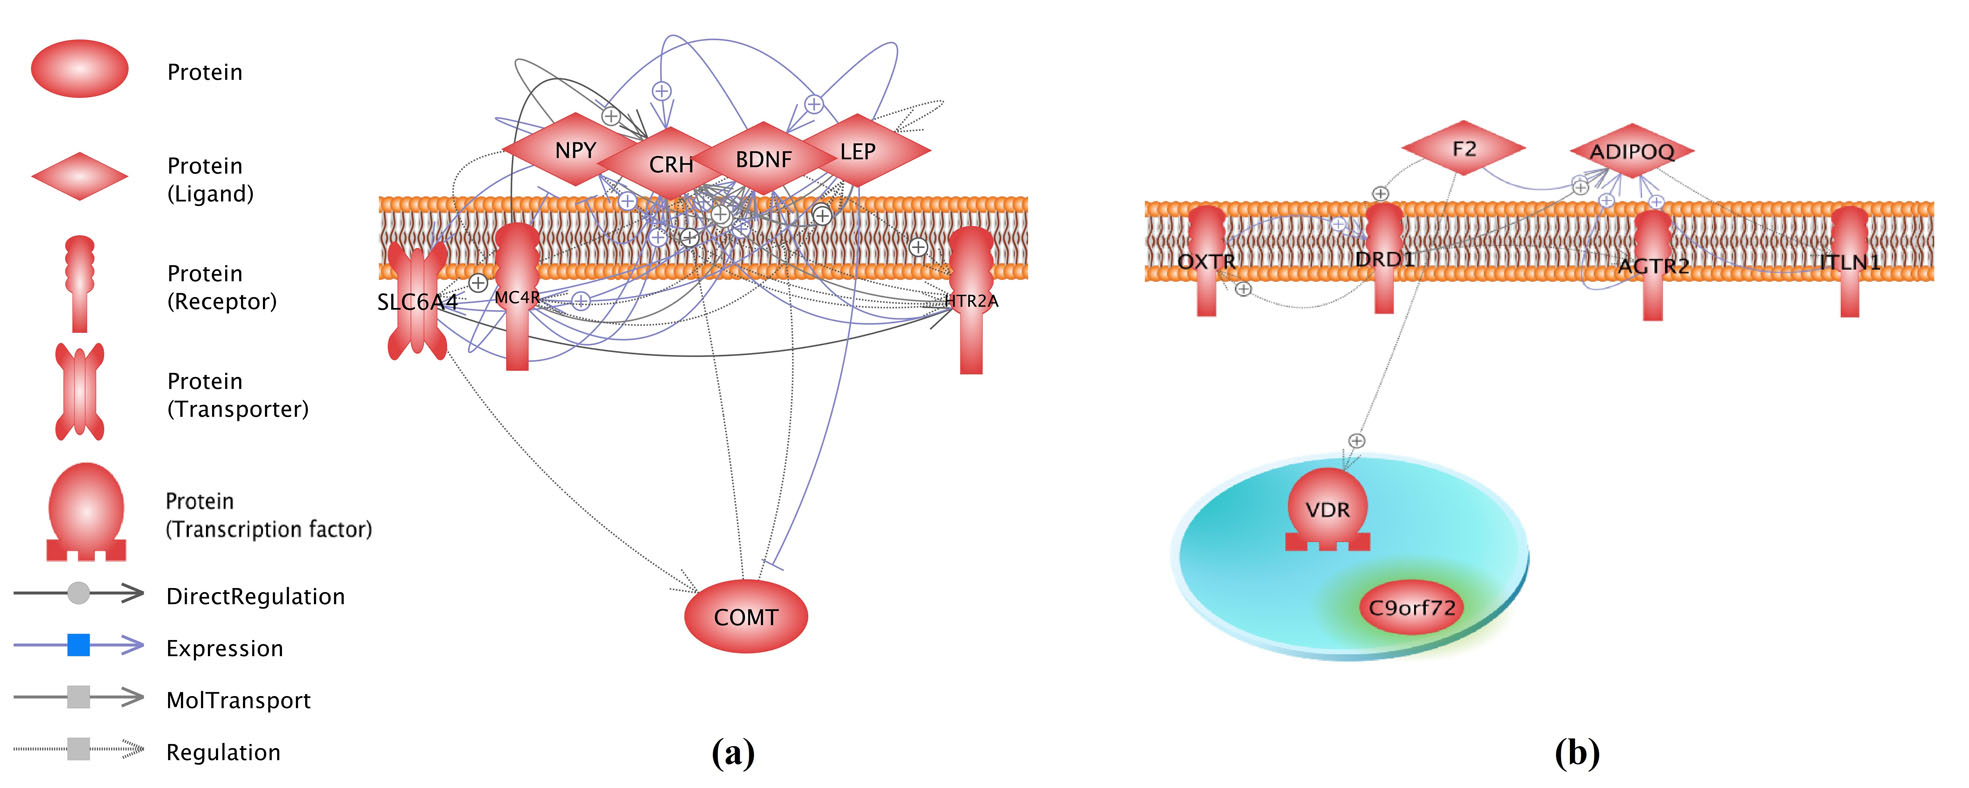 Fig. 2 Connectivity networks built by 8 genes from different groups. The networks were generated using Pathway Studio. The un-related genes are highlighted in green.
PGGI showed that, among the 69 genes (network nodes), there were 1,356 edges connecting 66 genes with 3 genes connected to no other nodes, as shown in Supplement Table S4. The average node strength (sum of the adjacent edge weights) of the network was 49.42, and the node strength for the 3 unconnected genes was signed with 0. Fig. 3 and Supplement Table S5present the network adjacency matrix of the genetic network built using the 66/69 genes.
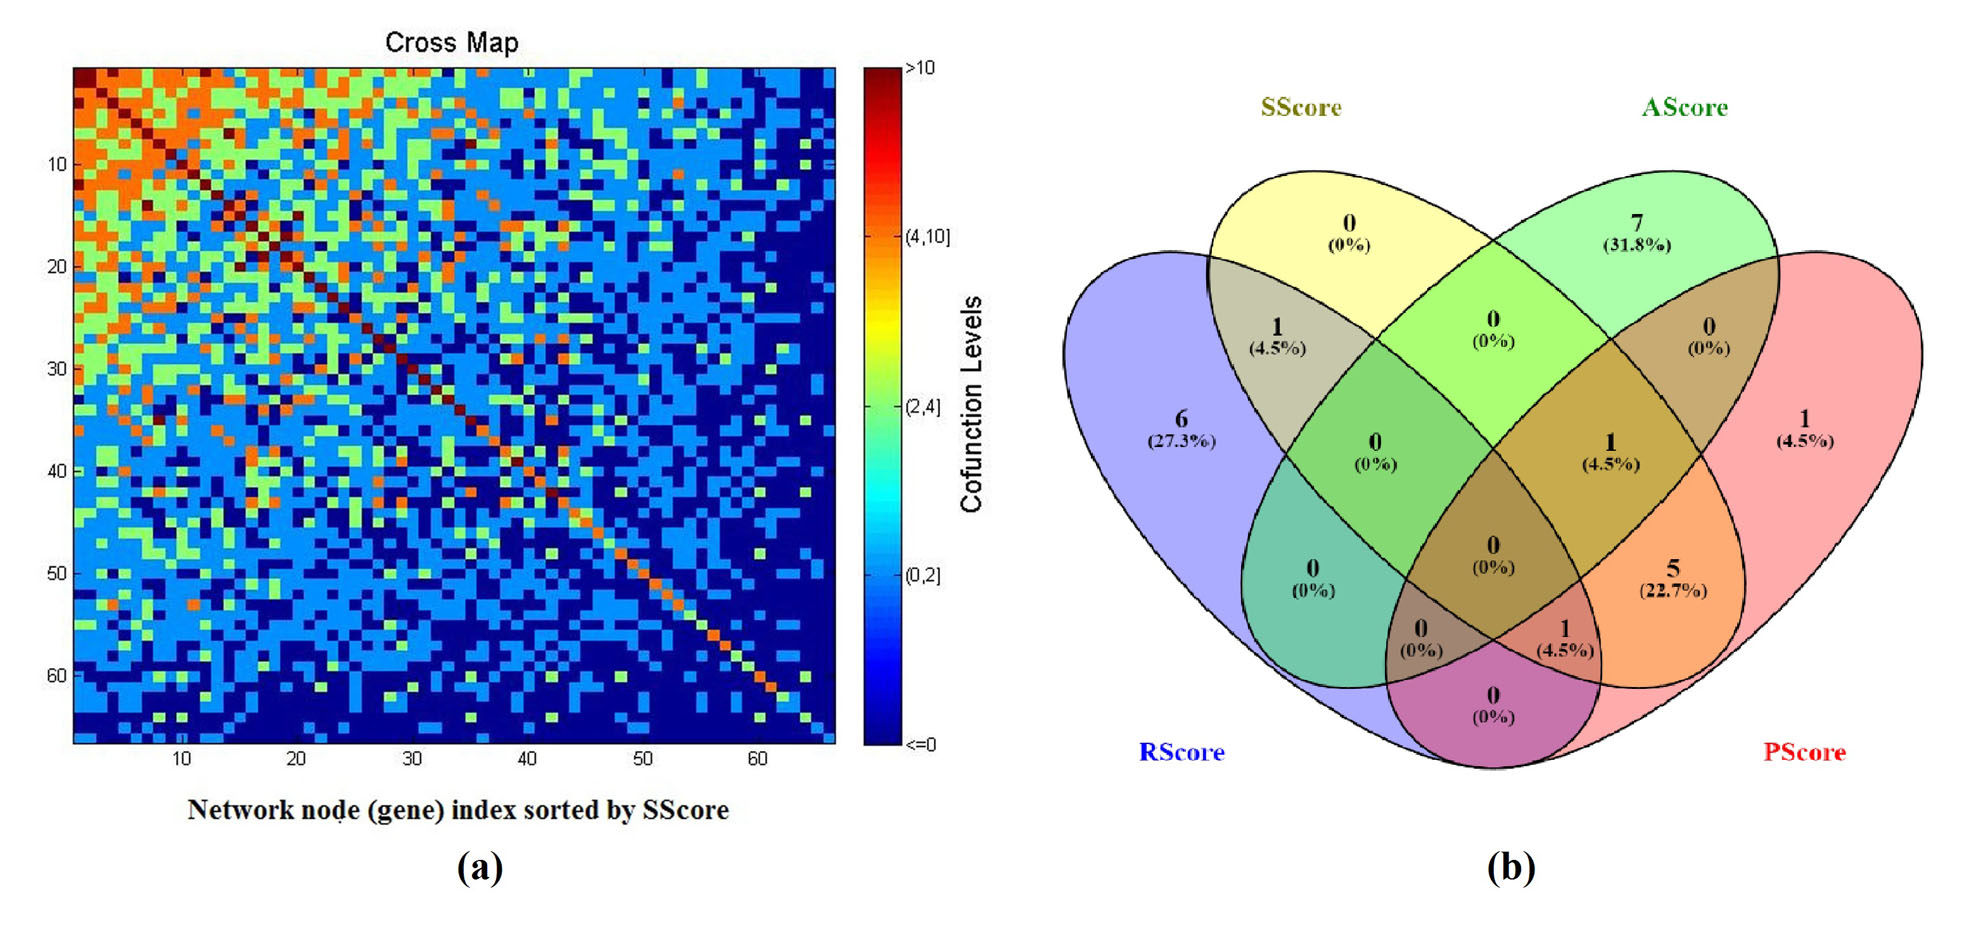 Fig. 3 Comparison of different metrics ranking the 69 genes. (a) Adjacency matrix of the genetic network built with the 66/69 genes as nodes and PGGI generated weights; (b) A Venn diagram of top 8 genes selected by different metrics.
Base on PGGI, a PScore and an SScore were calculated for each gene (see Supplementary Table S1a). The value of a PScore represents how many ED candidate pathways involved the gene, and a SScore showed how significant of a gene to the network.
To study the relationship between the two enrichment metrics and the two literature metrics, we performed a cross-analysis of the top 8 genes selected using different scores (Table 1), and presented a Venn diagram in Fig. 3(b) (Oliveros, 2007-2015). There was a strong overlap between PScore group and SScore (7/8). These 7 genes were those related to the most pathways that were significantly enriched. Among these 7 genes, CRH was the only gene identified within RScore groups, supported by 7 references. To note, this plays roles within 20 pathways and demonstrates strong relation to other genes Sscore = 1.71 (see Supplementary Table S1a).
On the other hand, there were 5 genes observed in both the PScore group and SScore group, but not in the RScore group, including: DRD2, AVP, OPRM1, IL6, ESR2. These genes play roles within many significant pathways with the disease (22.60 ± 1.14 pathways), and demonstrated strong network centrality (Sscore = 1.65 ± 0.10). However, they were old (ASocre: 7.60 ± 3.65 years) and were not frequently replicated (2.00 ± 1.22 references). To note, we identified no overlap between AScore group and any other groups, suggesting that these novel ED candidate genes were supported with a fewer studies, linked to less ED candidate pathways and genes.
4. Support from ED drug studyStudy on the ED-Drug relation data showed that there were 55 drugs that have been proven effective in treating ED, supported by 112 preclinical studies or clinical trials (see Supplementary Table S6). Furthermore, 22 out of the 55 drugs have been through clinical trials (Fig. 4 (a)).
The Gene-Drug relation study showed that there were more than 1000 relations connecting 64/69 ED candidate genes and 46/55 ED drugs, supported by 11,534 references (see Supplementary Table S7a and Table S7b). Additionally, we observed that 63/69 ED candidate genes presented 484 relations with all 22 clinical tested ED drugs, supported by 6,486 references (see Supplementary Table S8). We presented the Gene-Drug relations in Fig. 4 (b). In addition, the gene CRH that was the overlap of RScore, SScore and PScore groups, was connect to 23 out of the 55 ED drugs (see Fig. 4 (c) ), indicate that CRH may be an important genetic marker for ED. We present the relations and the supporting references in Supplementary Table S9.
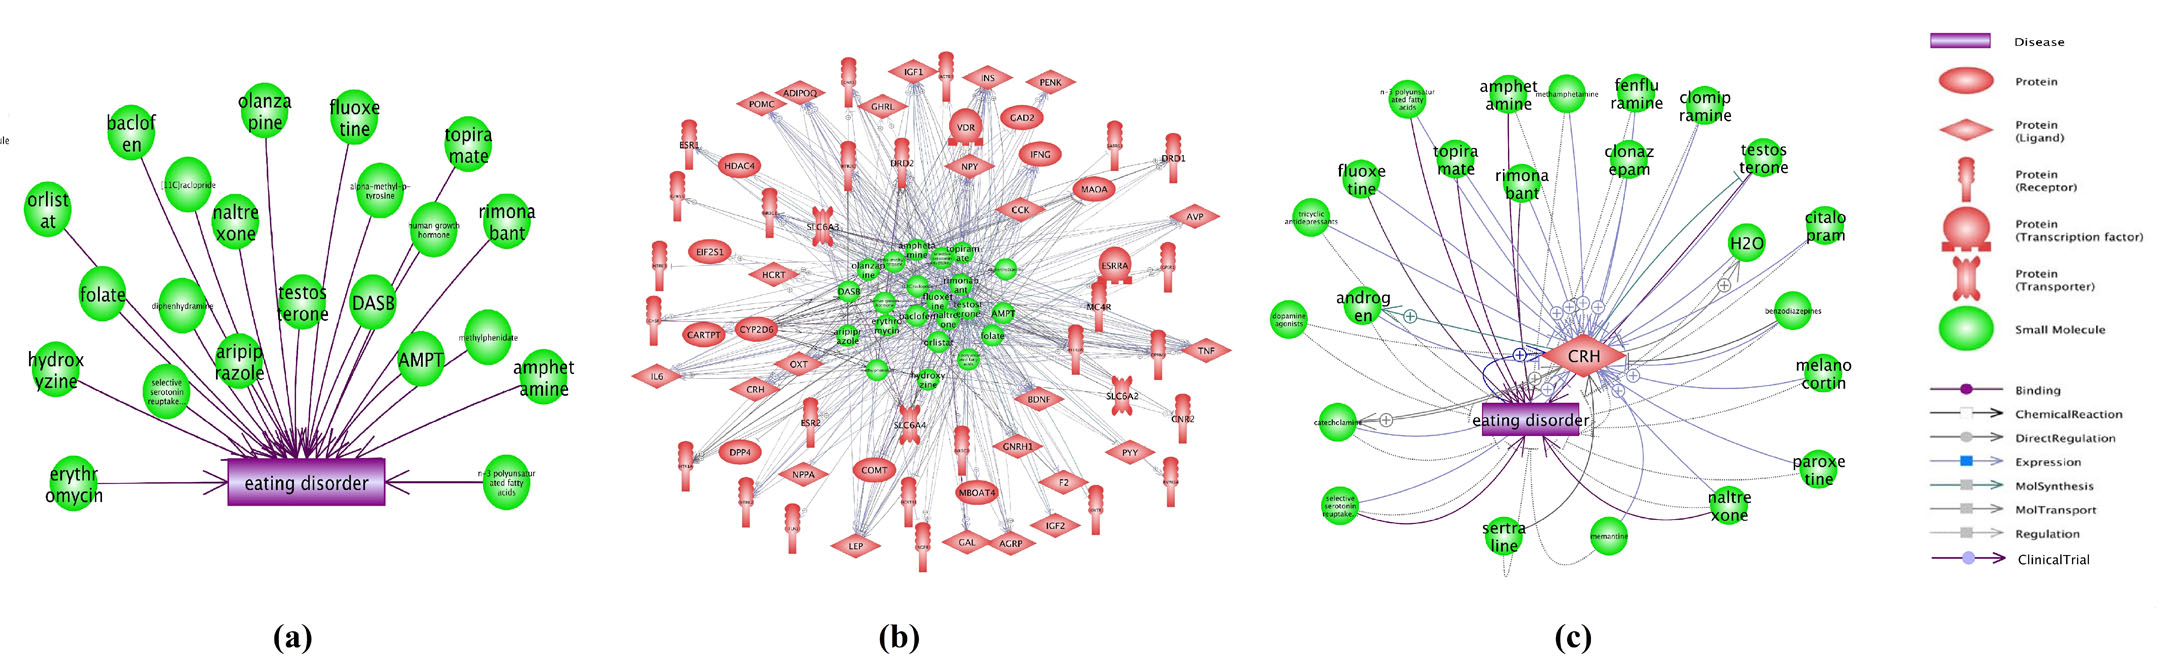 Fig. 4 The clinical proved ED drugs and their relation with the candidate ED genes.(a) The 22 Drugs/Small molecules presenting effective in clinical trials for the treatment of ED; (b) The top 484 relations between the 22 drugs and 63/69 ED candidate genes; (c) The relations between the 23 drugs and CRH.
The genetic cause of complex diseases, such as ED, is believed to be linked to a large genetic network. Results from this study revealed a complex genetic network associated with ED. Network node (gene) and edge (gene-gene interaction) attributes were studied and presented. In addition, we identified strong support for the gene-ED relation at small molecular level.
PEA results showed that most genes identified by this DM were included in the pathways previously implicated with ED (Supplementary Table S2), including 7 pathways/gene sets that were related to the neuronal system (with 42 unique genes), 1 to neuro transmitter (3 unique genes), 1 to brain function (with 8 unique genes), 6 to behavior (32 unique genes) and one ontology term related to aging (9 unique genes)[19-24]. Although there may be false positives from the separate studies, we hypothesized that the majority of these literature reported genes, especially the ones that were identified from significantly enriched pathways, should be functionally linked to ED.
Moreover, when the members of a gene set exhibited strong cross-correlation, PEA can boost the signal-to-noise ratio and make it possible to detect modest changes in individual genes[25]. The LGGI analysis showed that many of the frequently reported genes relating to ED were functionally associated with one another (Fig. 2), supported by more than 1000 references. PGGI results confirmed the observation and showed that 66/69 nodes presented a strong connectivity with each other (average node degree: 20.54 edges). The results indicated that these functionally linked genes possessed higher opportunities as true discoveries than that as noise (false positives). It was less likely that the gene network as a whole was falsely perturbed[25].
SNEA results demonstrated that many of the 69 genes (> 70 %) also identified as causal genes for other disorders (i.e. Obesity, Anxiety, Major depressive disorder) that were in strong association with ED[26-28], which supported the hypothesis that these genes were functionally associated with ED.
For each node of the ED genetic network, we proposed 4 metric scores as node attributes to evaluate their significance in terms of: 1) publication frequency (RScore), 2) novelties (AScore), 3) number of associated ED candidate pathways (PScore), and 4) network centrality (SScore). Using the proposed quality metrics scores, one was able to rank the genes according to different needs/significance and pick the top ones for further analysis (see Supplementary Table S1a). Specifically, we observed that CRH was frequently replicated (supported by 7 references) and connected to multiple significantly enriched ED candidate pathways (with 20 pathways). Moreover, CRH presented the highest network centralities (SScore = 1.71), suggesting that they are important nodes for the whole disease network and likely pose biological significance. In addition, we identified that CRH is related to 23 ED effective drugs with 61 relations (Fig. 4 (c)). These CRH-ED drug relations were supported by 308 references (Supplementary Table S9), providing further support for its pathogenic significance to ED.
Alternatively, there were 5 genes observed in both PScore group and SScore group, but not in RScore group. Although these genes were old in terms of ASocre (7.6 ± 3.65 years) and were not frequently replicated (2.00 ± 1.22 references), they played roles within multiple ED candidate pathways (22.60 ± 1.14 pathways) and demonstrated high centrality for the whole network (Sscore = 1.65 ± 0.10). For example, the gene DRD2 (Sscore = 1.77), although reported 5 years ago and thus far only 4 references supported its relation with ED, was linked to 66/69 genes and played roles within 23 significantly enriched ED candidate pathways, many of which have been implicated with ED: feeding behavior (0007631); synaptic transmission (0007268); signal transducer activity (0009369); axon (0030424); negative regulation of blood pressure (0045776); locomotory behavior (0007626)[19-22]. The observations suggested that these genes may play significant roles in the pathogenic development of ED and were thereby worthy of further study.
Through the ED-drug relation data study, we showed that the majority of these ED candidate genes (64/69) were associated with the 46 of 55 ED effective drugs, supported by over 11K references (Supplementary Table S7b). Moreover, a large portion of the ED candidate genes (63/69) presented relation with the 22 clinical tested ED drugs (Supplementary Table S8). Our results help to understand the underlying mechanisms and biological processes of ED and support the hypothesis that the majority of the 69 ED genes plays a role in the pathogenic development of ED. For example, paroxetine has shown anti-ED effect with an unclear mechanism may deserve further investigation[29,30]. However, our study showed that paroxetine presented 22 relations with 20/69 ED genes that were related to ED (See Supplementary Table S7b), providing supporting information in understanding the anti-ED effect of paroxetine.
Nevertheless, this study has several limitations that should be considered in future work. Although the 69 gene-ED relation were supported by 199 articles, it is possible that some gene-ED associations were left uncovered. Additionally, although the proposed metrics help in ranking the genes and selecting the top ones with specific significance, further network analysis using more complex algorithms (e.g., graph theory) may extract additional meaningful features to identify biologically significant genes to the disease.
We conclude that ED is a complex disease whose genetic causes are linked to a network composed of a large group of genes. This study provided a comprehensive weighted genetic network with node attributes for ED, which could be used as groundwork for further biological/genetic studies in the area.
The authors declare no conflicts of interest.
This research did not receive any specific grant from funding agencies in the public, commercial, or not-for-profit sectors.
1.
2.
3.
4.
5.
6.
7.
8.
9.
10.
11.
12.
13.
14.
15.
16.
17.
18.
19.
20.
21.
22.
23.
24.
25.
26.
27.
28.
29.
30.
Fan F, Manor LC. The Genetic Network underlying Eating Disorder and its Small Molecular Level Supports. J Psychiatry Brain Sci. 2016;1(4):2; https://doi.org/10.20900/jpbs.20160016

Copyright © 2020 Hapres Co., Ltd. Privacy Policy | Terms and Conditions


